Hey guys, how are you doing? Today’s post is about Live # 29 so you can understand everything about row (RLS), columns and page security! A very complete material to help you on a daily basis.
We will show several usage examples! Each company has a specific information security application rule but, by understanding the concepts presented in the examples, you will be able to use them as a basis to solve your problems. So, come with me!
RLS – Row Level Security
The objective of Row Level Security (RLS) is to restrict the rows that will be visible to a certain user. The advantage of this feature is having a single report and optimizing maintenance! Then, you have a single report that filters the results presented to the user who is viewing.
The process steps are:
- Define access rules in Power BI Desktop
- Test the created rules
- Publish report to Power BI Online
- Assign access rules to users
- Share with users
Static RLS
Let’s have look at the tables we will work on and the relationship between them? So, in model:
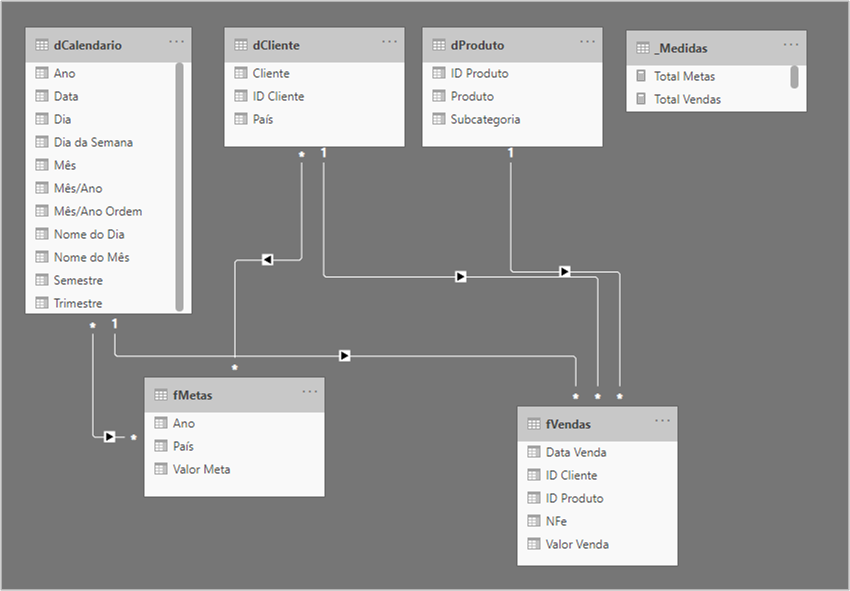
Image 1: Model with tables and relationships
In our scenario, we have 3 countries (France, Germany and United Kingdom) and we want to restrict the information for each one, as we have a responsible manager for each country. So, when the France manager enters Power BI Online to see the report he will only see the information related to that country.
The complete view (without RLS applied) of the report is as follows:
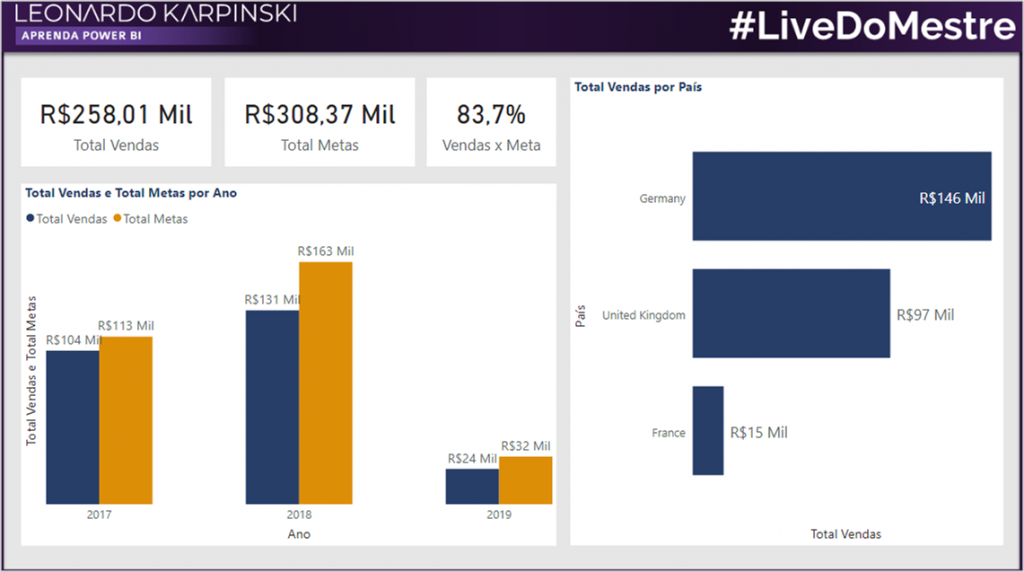
Image 2: Report General View
Creating the rules
Access rules are created in Manage roles (“Gerenciar funções” in the image below):
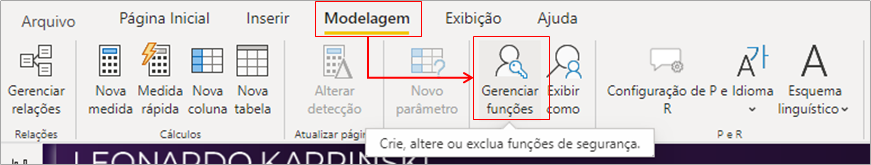
Image 3: Roles management
The management we are going to do is called static, because for each filter that will be applied (France, Germany and United Kingdom) we have to create a rule.

Image 4: Area for rules creation
The first filter we are going to create is for France (“País” = France) and the others are done in a similar way by changing the name:
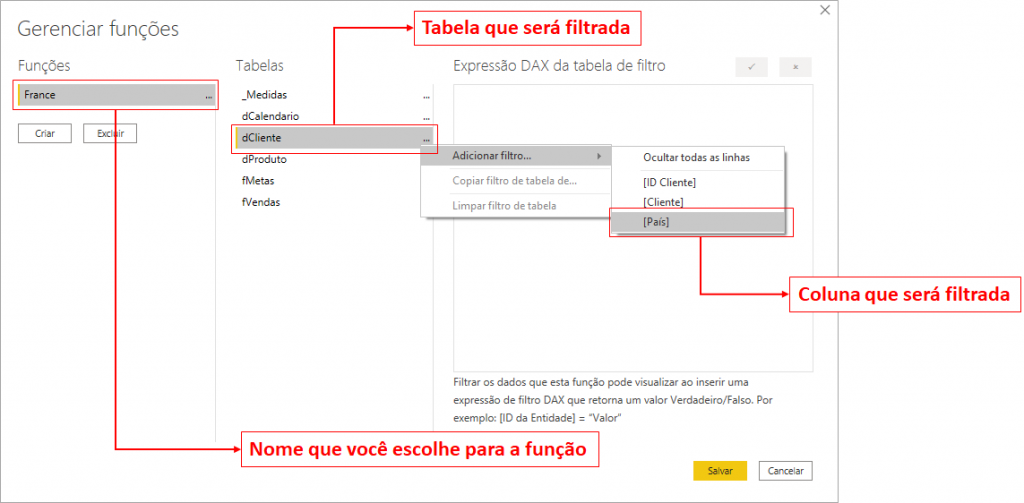
Image 5: Role creation for France
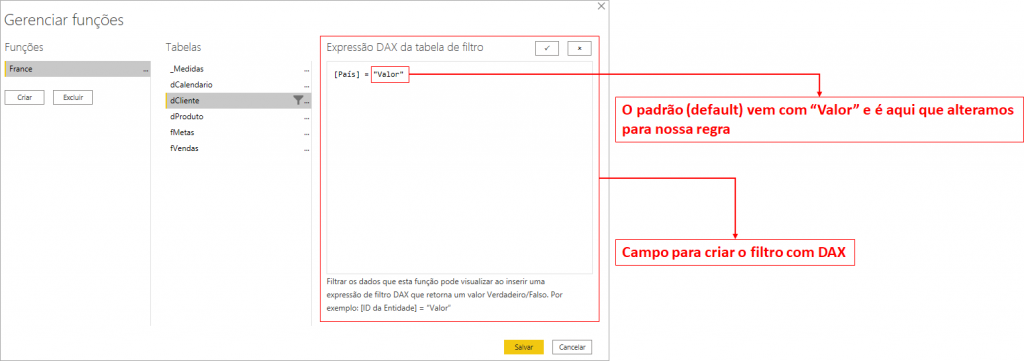
Image 6: Assigning rule in DAX
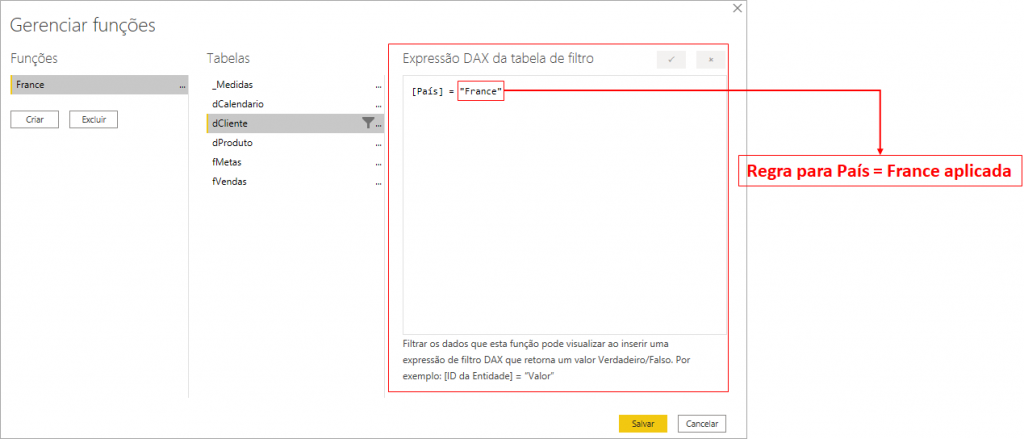
Image 7: Assigning rule in DAX
And in the same way we create for Germany and United Kingdom:
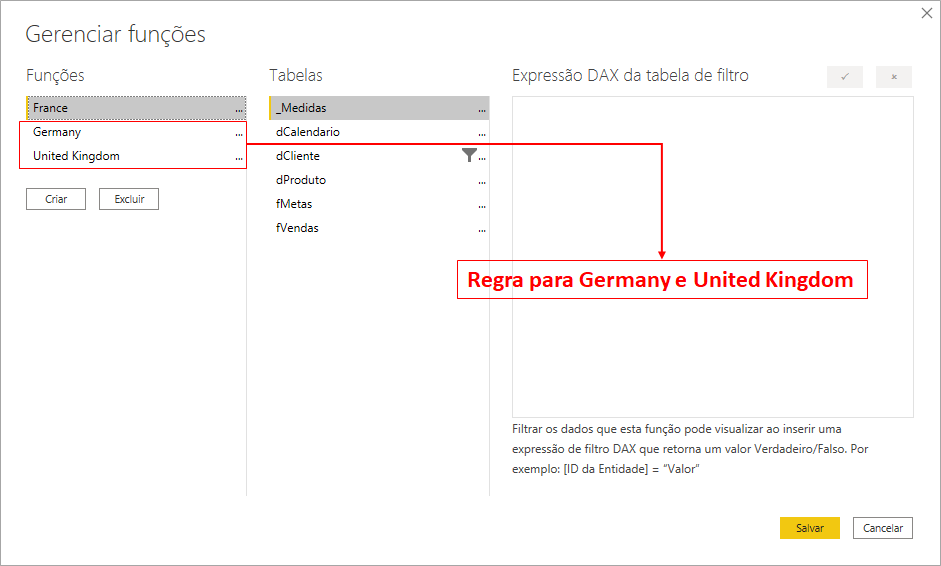
Image 8: Assigning the other rules
Steps:
In "Modeling" select "Manage roles" → Select "Create" → Name the role → Select the table dCliente → Select "Add Filter" → Select the column [País] → Assign the DAX filter
DAX Formulas:[País] =
“France”
[País] =
“Germany”
[País] =
“United Kingdom”
Testing the rules
There is a very cool feature in Power BI Desktop that allows you to view your report as one of the users of the rules created! So, before publishing be sure to test. Here we will test the rule for the user with France view:
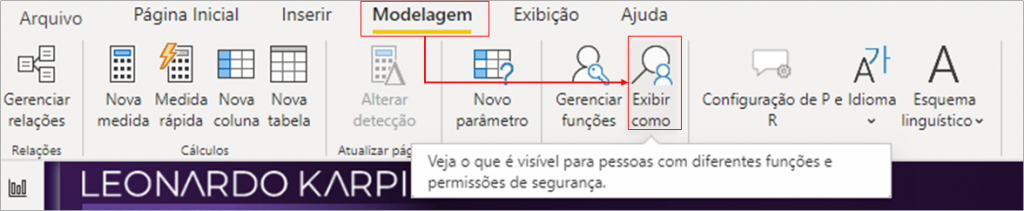
Image 9 : Changing the view mode
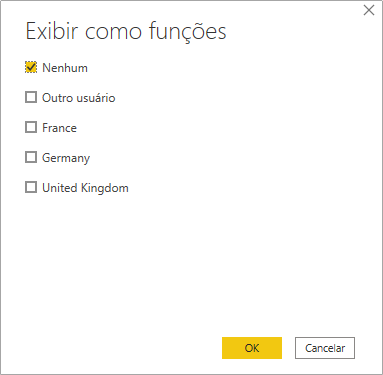
Image 10: Standard view mode (default)
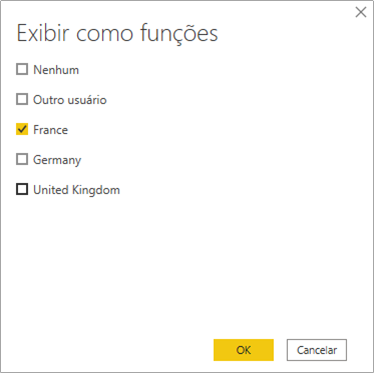
Image 11: View with the France rule applied
Image 12: View result
Steps:
In "Modeling" select "View as" → Select the role as you want the report to be presented
Rules publishing and assignment – Power BI Online
Test is ok? If so, let’s publish the report to Power BI Online. There is no secret here, just do as you are used to and select the correct workspace:

Image 12: Publishing report
It can be: security group, distribution list, specific email
This doesn’t mean that the report will be shared with the people on the list, it means that the role rule will be assigned to the users on the list!
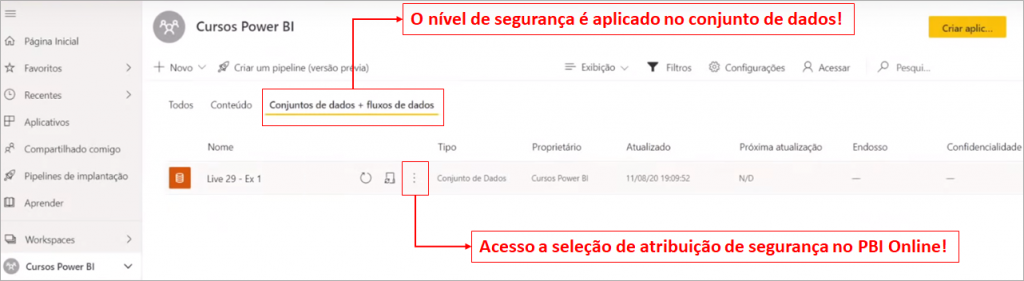
Image 13: Security application in PBI Online
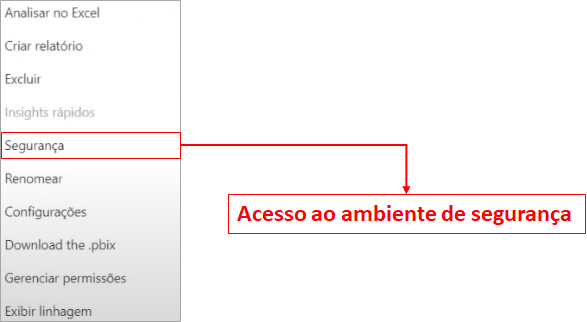
Image 14: Settings area
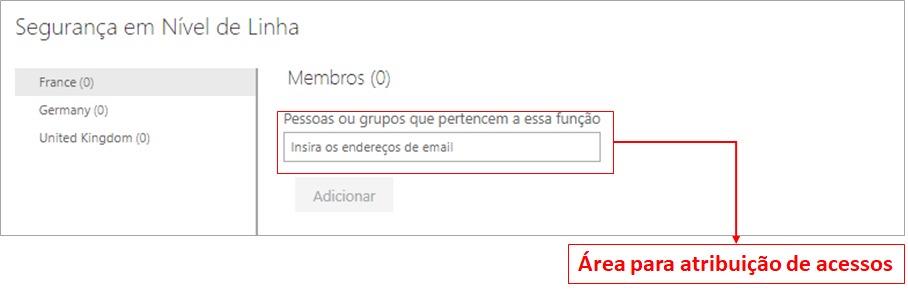
Image 15: Assigning users
Steps:
1. In "Home" select "Publish" → Choose the publishing workspace
2. In PBI Online on "Dataset + data flow" click on the 3 dots → Select "Security" → Assign the user/group/list that belongs to that role
Once users are assigned, it is also important to know the ways of sharing in which RLS works:
- Individually sharing
- Share via an app
- Include the user as a Viewer in Workspace
| Important: If you include the user as a contributor, member or administrator in Workspace, RLS will NOT work. |
| Important: RLS does NOT work on public reports !! Besides, it only works if both the user who will publish and the user who will view the report have a PRO license. |
| Important: For Power BI Embedded the development rules in Power BI Desktop are the same, but programming is required to assign rules. |
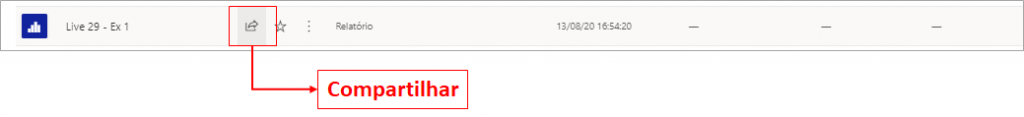
Image 16: Sharing in a individual way
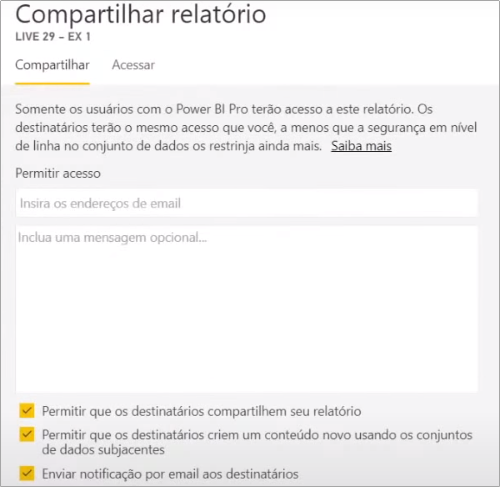
Image 17: Select the users or group for sharing
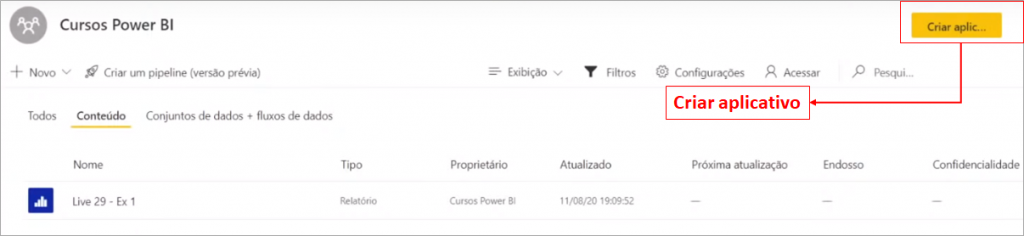
Image 18: App creation
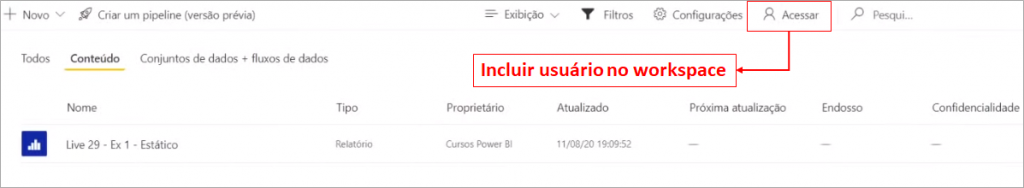
Image 19: Including users in workspace
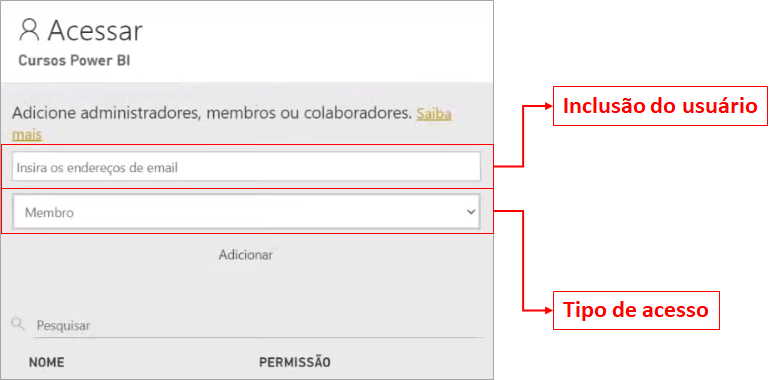
Image 20: Users and group selection for sharing
Dynamic RLS
The scenario for dynamic RLS is different from the first. Imagine that instead of defining by Country, the rule will be made from the following list of users:
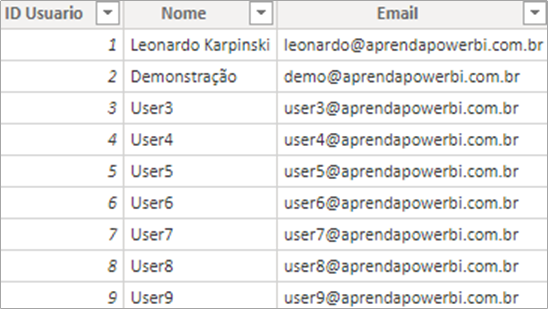
Image 21: List of users
| Important: The user table must be kept up to date, regardless of whether it is a database/Excel table, in order to have the correct filters assigned to the reports! |
In this scenario, there may be on or more customer for each user, but there can only be one user for each customer. You can imagine it as a salesperson who has a customer base, but each customer is served by a specific salesperson.
In this case, the relationship between the dUsuario and dCliente tables is 1 to many. In the model model, we have to create the relationship between these tables:
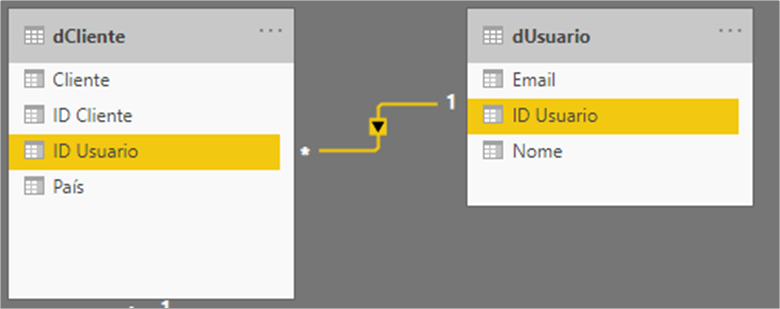
Image 22: Relationship between tables
For Dynamic RLS, we also have to create a filter rule. Just imagine if we were to do the same procedure as in the static. To filter these users we would have to create 9 filters …. and if you were to filter by client (360 rules) then, imagine the time you would spend on it. Shall we improve? Imagine if more users or customers are added and you have to update your rules every time that happens. Unviable, right?
Come with me, I’ll do it in a different way! The control will be done in the tables.
| Important: In dynamic RLS it is necessary to have a user table (ex.: salespeople / employees from each sector) with the email that will be used to access Power BI Online in one of the columns. |
This control is done using the user’s email that he accesses Power BI Online. This email information that generates the filter in the table dCliente from the table dUsuario. Then, the filter is propagated to the table fVendas and fMetas.
Wow, cool! Too much theory? So, let’s put it into practice:

Image 23: Manage roles
Image 24: Create new role
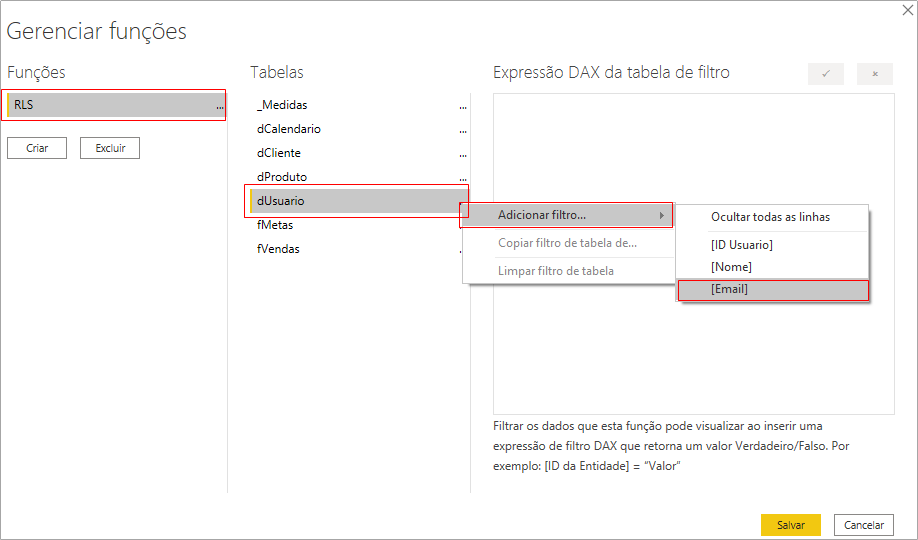
Image 25: Filter by user e-mail
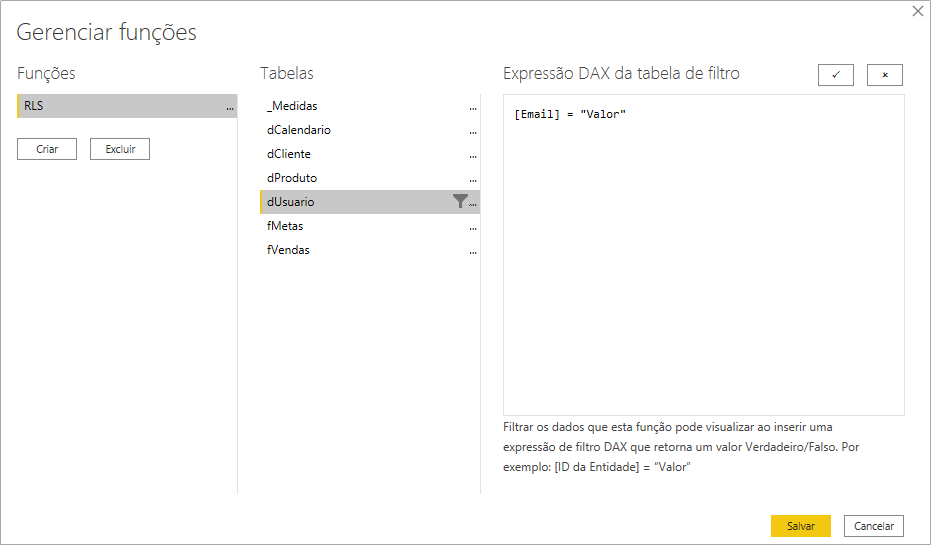
Image 26: Expression without editing
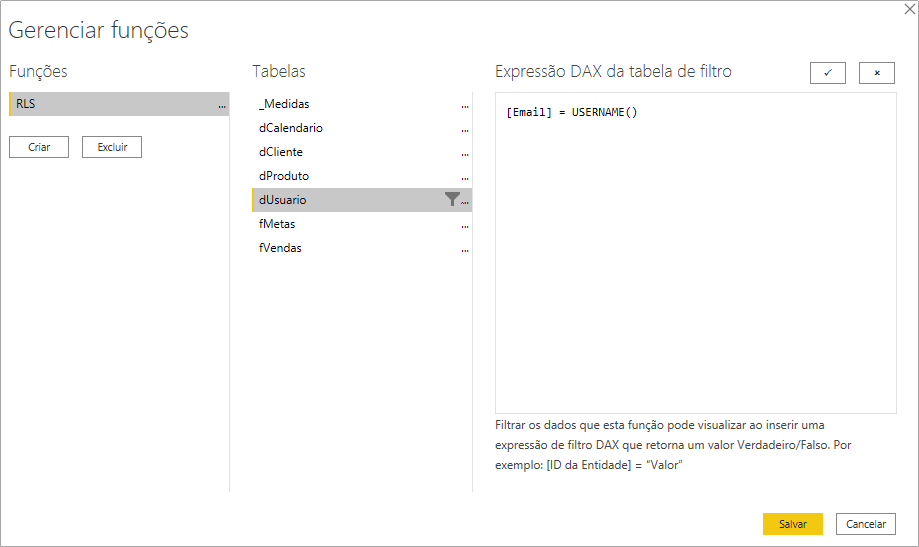
Image 27: E-mail filter expression
DAX Formula:[Email] =
USERNAME ()
Steps:
In "Modeling" select "Manage roles" → Select "Create" → Name the role → Select the table dUsuario → Select "Add Filter" → Select the column [Email] → Assign DAX filter
The USERNAME function returns the user who is logged in the report. That’s exactly what we need, isn’t it ?! So, from this information we generate the filter.
| Tip: When we are logged in to Power BI Desktop, the USERNAME function returns the user logged in to the machine and in Power BI Online it returns the email of who is in the Online environment. |
Rule, created! What is the next step? Publish?? Of course not! We have to test! Let’s test for user3@powerbiexperience.com:

Image 28: Exhibition test
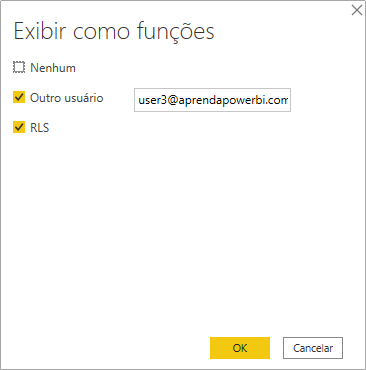
Image 29: User choice
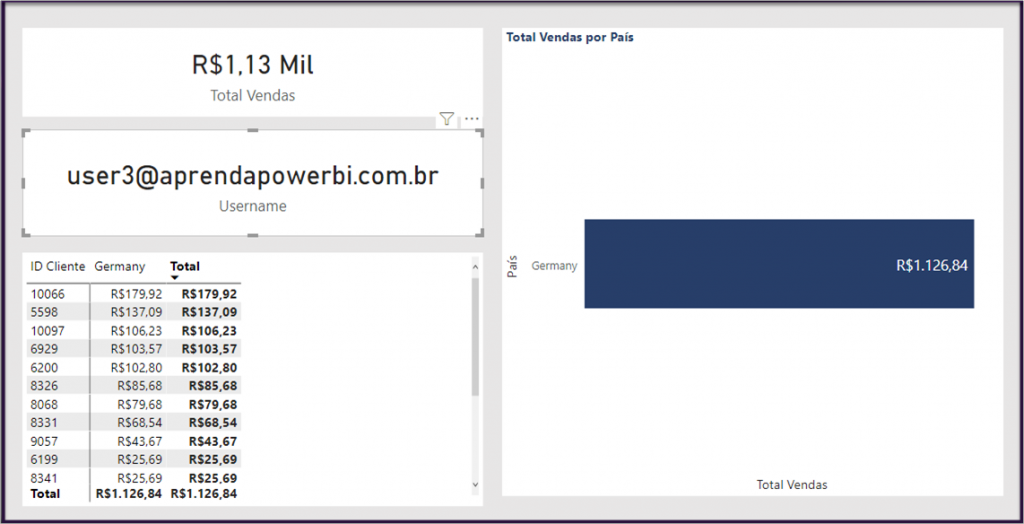
Image 30: Filter result
Steps:
In "Modeling" select "View as" → Inser the user and select the created rule
If we go to “Data”, we can see the filter applied in the tables:
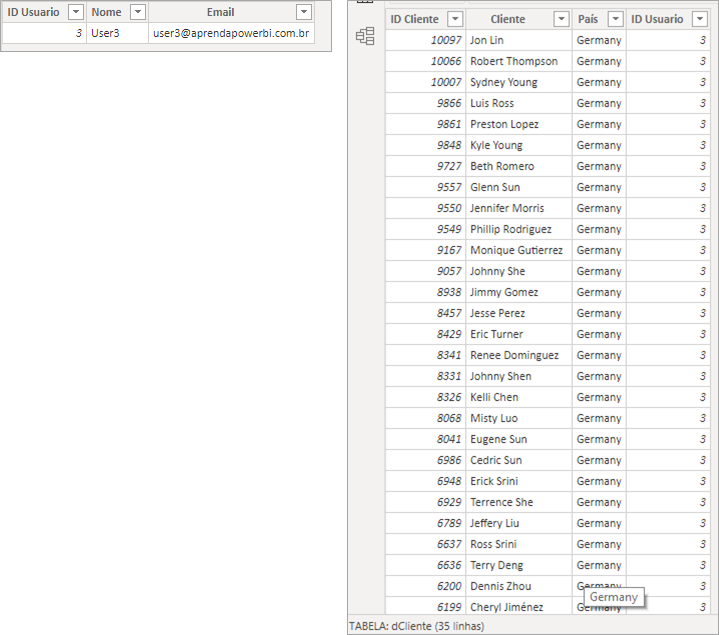
Image 31: dUsuario and dCliente Tables (only 35 rows)
Cool, and how would it be for a Company Director? He/She has to see everything, right? For this type of case we use the artifice of the admin rule:
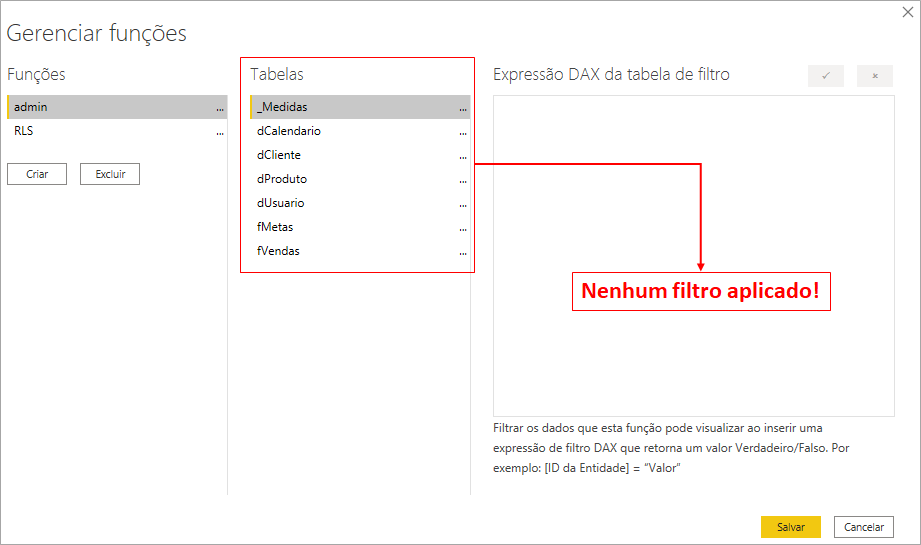
Image 32: Admin filter
As there is no filter rule in this role, whoever is in that group will see the full report!
Report ready, next step is to publish:
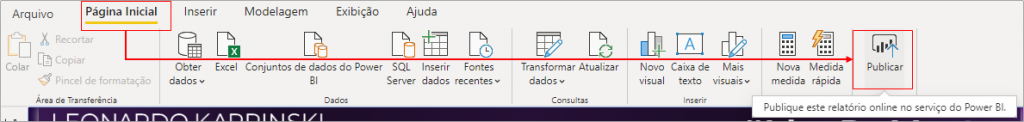
Image 33: Report publish
| Important: As soon as you publish a report with an RLS rule, all viewer users must be assigned to a rule! Otherwise, the report will appear as broken for the user. |
Management in Power BI Online is identical to that for Static RLS!
So, what do you think? Will it help you on a daily basis? Leave it in the comments and continue with more examples!
Dynamic N-N with relationships
Here we will see the much talked about relationship of many to many!
In this scenario, each user can have one or more customers, and unlike the example given above, each customer can also have more than one related user. You can imagine it as if a store salesperson sells to several customers and if the customer wants, he can also buy from another seller.
This is a classic case of Many to Many! To make this relationship we will use a support table. This type of table has two names in the community: bridge table and factless fact table! I particularly prefer the first Bridge Table.
Our bridge table, contains all customer relationships with users:
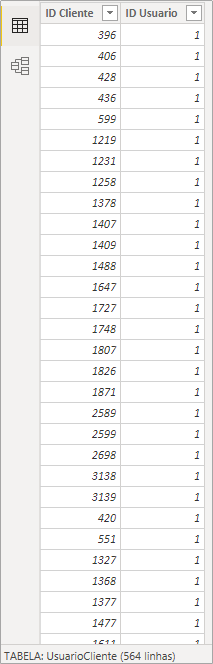
Image 34: Bridge Table (UsuarioCliente)
And it has 2 relationships: one with the dCliente table and another with the dUsuario table:
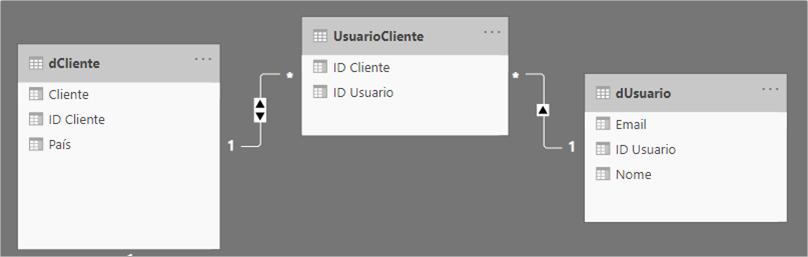
Image 35: Bridge Table Relationships
The relationship between the dUsuario and UsuarioCliente (Bridge Table) is commom 1 to to Many. The relationship between UsarioCliente (Bridge Table) and dCliente is Many to 1 but in both directions!
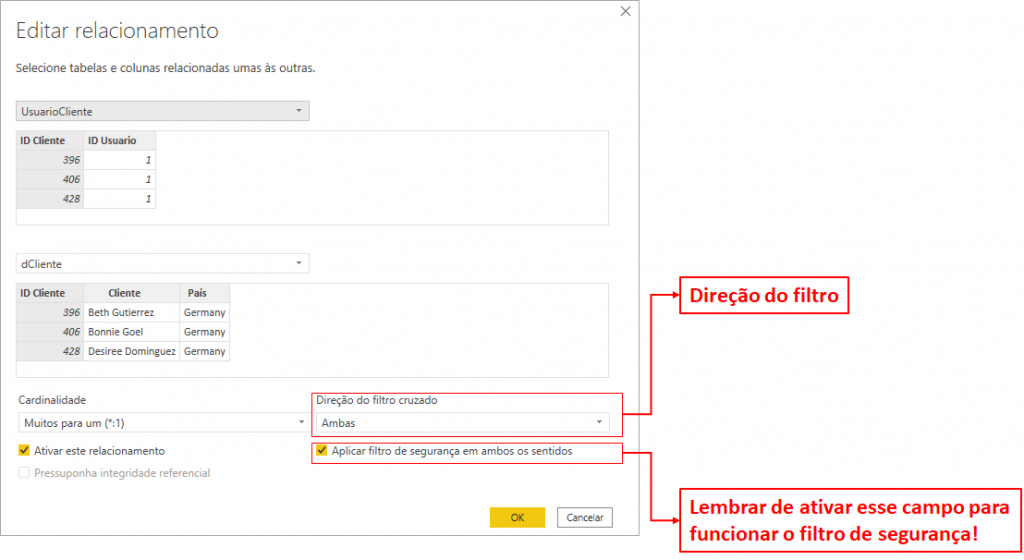
Image 36: Relationship between Bridge Table and dCliente
Steps:
1. Create the relationship between the dUsuario and UsuarioCliente (Bridge Table) tables through ID Usuario column with unic direction and cardinality Many to one (*:1)
2. Create relationship between UsuarioCliente (Bridge Table) and dCliente table through ID Cliente column in both directions and cardinality Many to one (*:1). Activate filter in both directions!
Remember that rule (RLS) we created in “Manage roles” ??! So, it’s the same one we use in this type of case! Applying the USERNAME rule that is the user from Power BI Online. And now, shall we publish? No!! Let’s take the test for user5@powerbiexperience.com:

Image 37: Exhibition test
Image 38: User choice
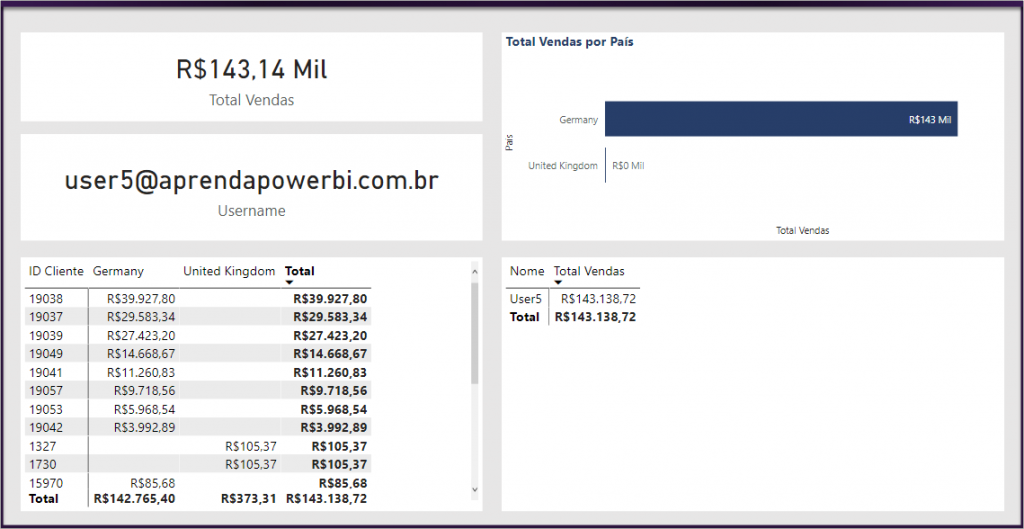
Image 39: Filter result
Steps:
In "Modeling" select "View as" → Insert the user and select the created rule
It worked …. now we can publish:

Image 40: Publishing the report
And for this type of RLS, the management part in Power BI Online is also identical to the static part!
Dynamic N-N with DAX
The scenario is identical to the example in the previous one! Each user can have one or more customers, and each customer can also have more than one related user. You can imagine it as if a store salesperson sells to several customers and if the customer wants, he/she can also buy from another seller.
The difference this time is that we will not use relationships between tables to make the filter …. we will do it via DAX. We will create a virtual table using CALCULATETABLE and VALUES in the expressions of the filters in “Manage roles”:
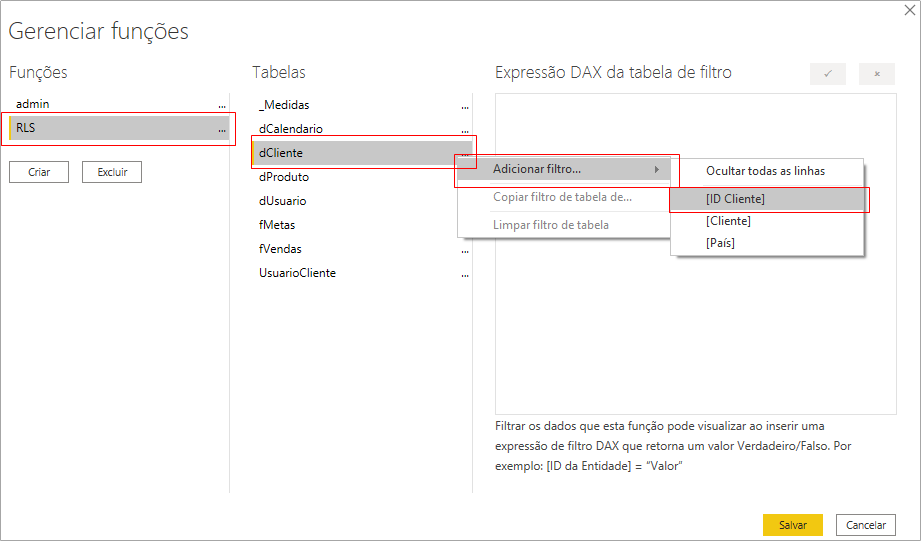
Image 41: New RLS creation
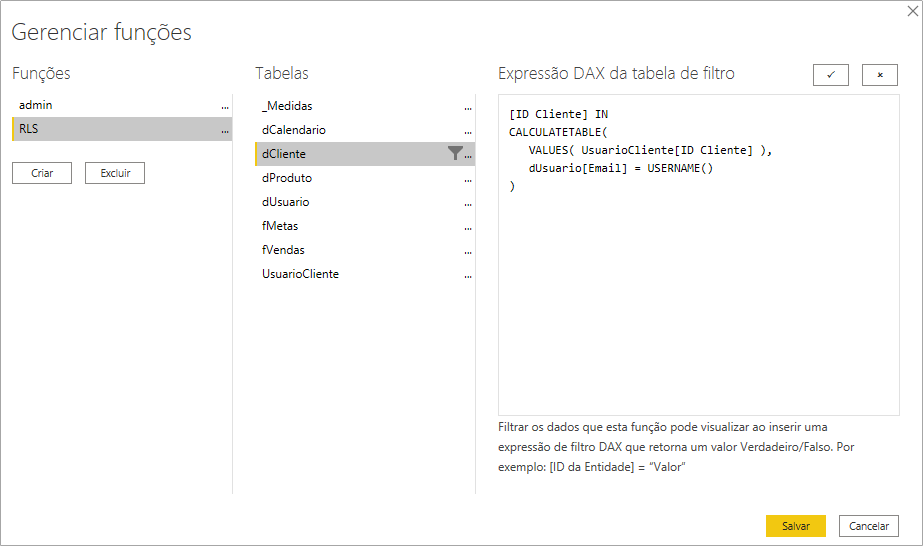
Image 42: Filter for dCliente
DAX Formula:
[ID Cliente] IN
CALCULATETABLE(
VALUES( UsuarioCliente[ID Cliente] ),
dUsuario[Email] = USERNAME()
)
Steps:
In "Modeling" select "Manage roles" → Select "Create" → Name the role → Select the table dCliente → Select "Add Filter" →  Assign DAX filter
Ready! Let’s publish? Noooo ….. let’s test! Now as user7@powerbiexperience.com:
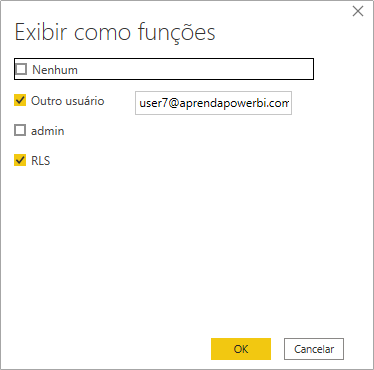
Image 43: User choice
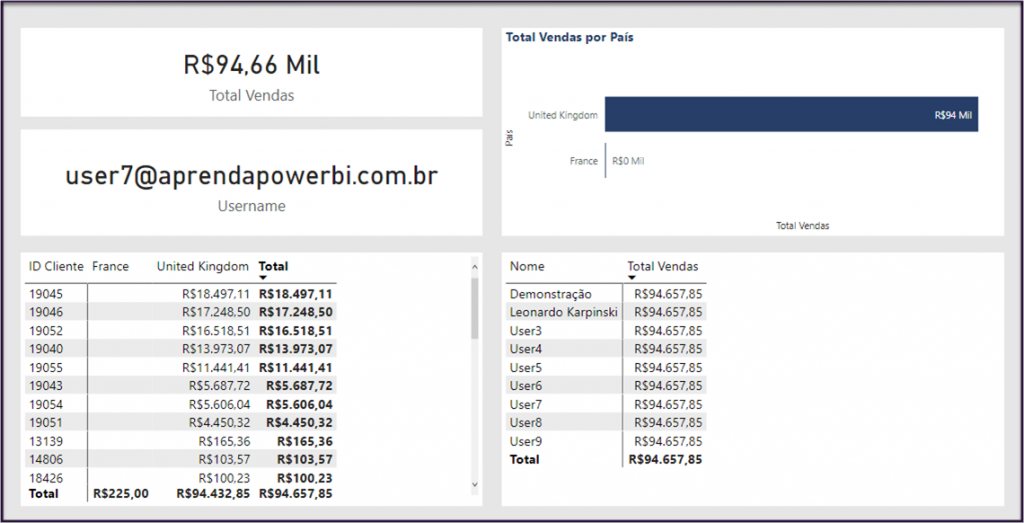
Image 44: Filter Result
Steps:
In "Modeling" select "View as" → Insert the user and select the created rule
| Important: In all of these cases, the user is filtering the customer. However, he sees all the information in that customer’s sales chart! Not eliminating the sales lines for different users, as the table fVendas and users are not directly related. |
Dynamic N-N with Manager
In this scenario, let’s assume that when I publish the report on Power BI Online, we cannot use the admin feature (Remember it? For the directors who have access to all information). So, we will solve this problem within the model in Power BI Desktop.
In the dUsuario table, we have one more column stating whether that user is (value = 1) or not (value = 0) manager (gerente) and will have access to the information:
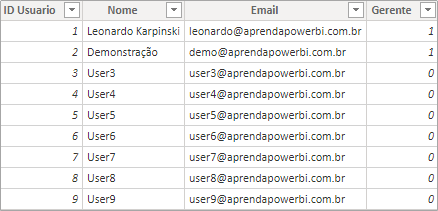
Image 45: dUsuario table with the extra column
The database model is the same as the one used with the Bridge Table (UsuarioCliente):
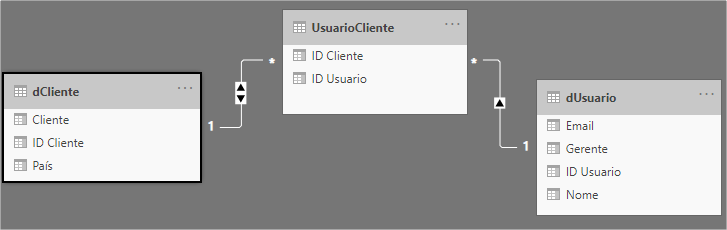
Image 46: Relationship Model with Bridge Table (UsuarioCliente)
However, the RLS rule in this case is different whether the user has a value of 1 (it’s a manager) or not (so it is zero and it’s not a manager). So, with the help of variables and the LOOKUPVALUE and IF functions, let’s set up the following rule for the dUsuario table:
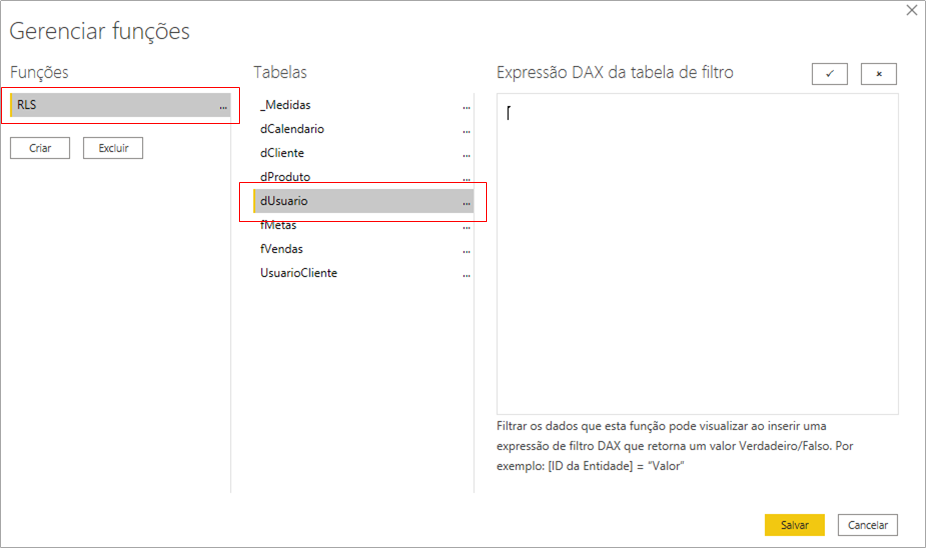
Image 47: New RLS creation
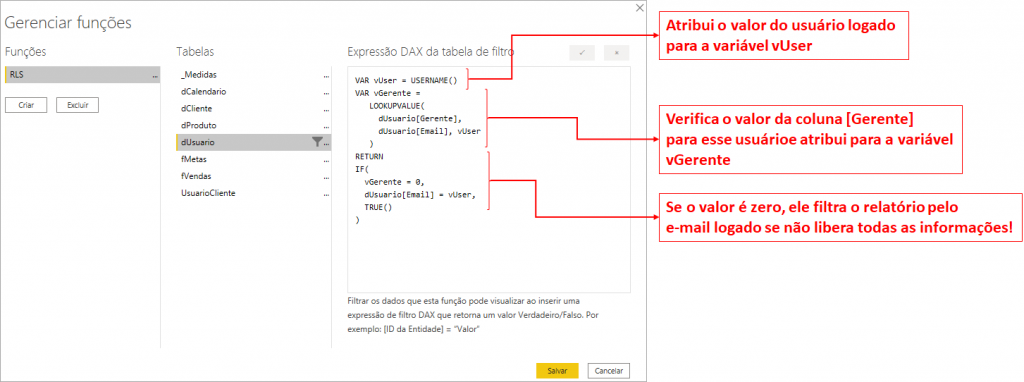
Image 48: Filter for the dUsuario table
DAX Formula:
VAR vUser = USERNAME()
VAR vGerente =
LOOKUPVALUE(
dUsuario[Gerente],
dUsuario[Email], vUser
)
RETURN
IF(
vGerente = 0,
dUsuario[Email] = vUser,
TRUE()
)
And now what do we do? We test again ….. now for user9@powerbiexperience.com (manager value 0) and demo@powerbiexperience.com (manager value 1, with access to all information):
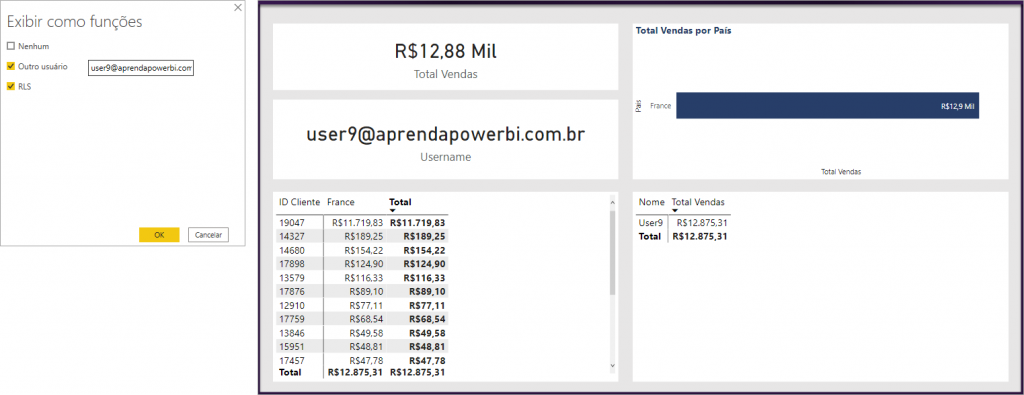
Image 49: Filter and result for user9@powerbiexperience.com
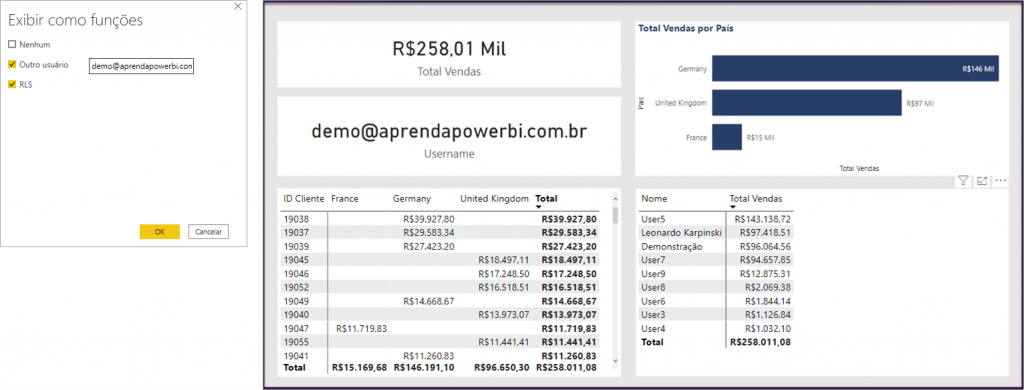
Image 50: Filter and result for demo@powerbiexperience.com
Steps:
In "Modeling" select "View as" → Inser the user and select the created rule
With the test carried out, you publish the report and apply the security rules in Power BI Online.
Dynamic N-N with Simple Hierarchy
This is the most standard scenario that we find in the market where we have a hierarchy of employees and their leader. Then, in the same table we have the users and their e-mails and also the leaders (managers) with their respective e-mails:
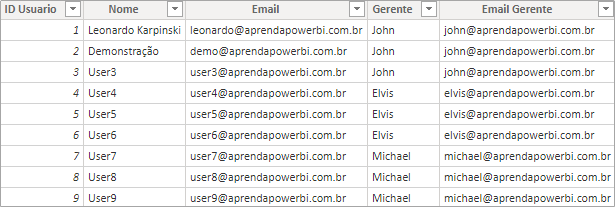
Image 51: Users tables with their leaders
In this type of case we have to have 2 rules for managing roles. The filter for the user will be the user’s email filtering the [Email] column and the manager’s filter will be the manager’s email filtering the [Email Gerente] column:
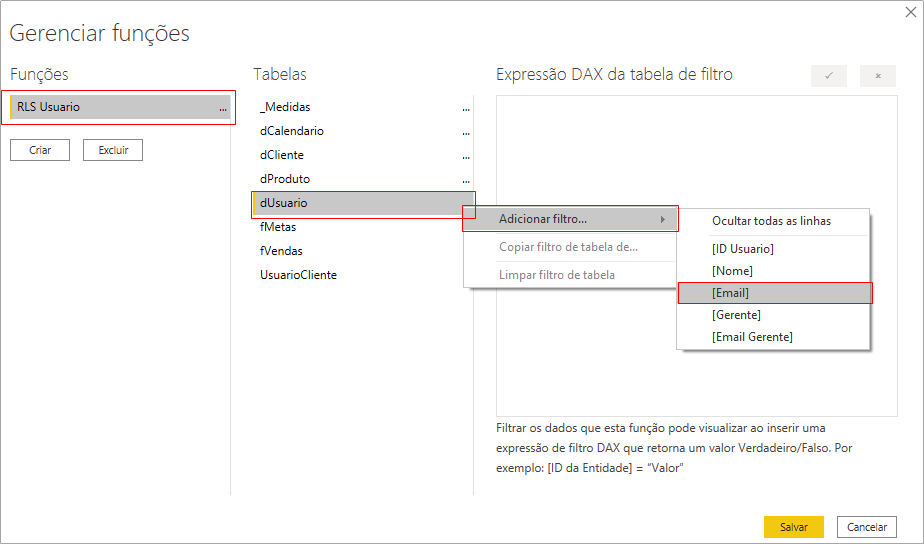
Image 52: RLS for User (Usuario)
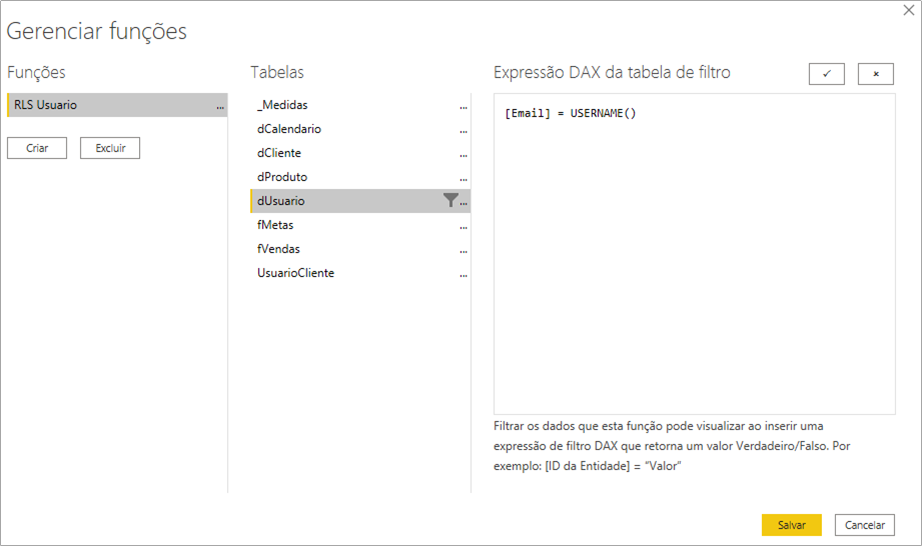
Image 53: Filter applied
DAX Formula:[Email] =
USERNAME ()
Steps:
In "Modeling" select "Manage roles" → Select "Create" → Name the role → Select the dUsuario table → Select "Add Filter" → Select the [Email] column → Assign the DAX filter
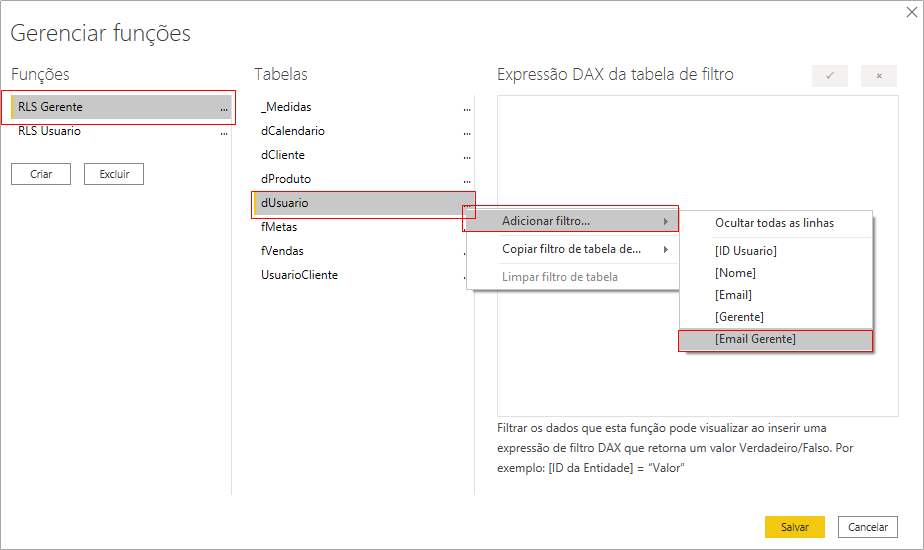
Image 54: RLS for Manager (Gerente)
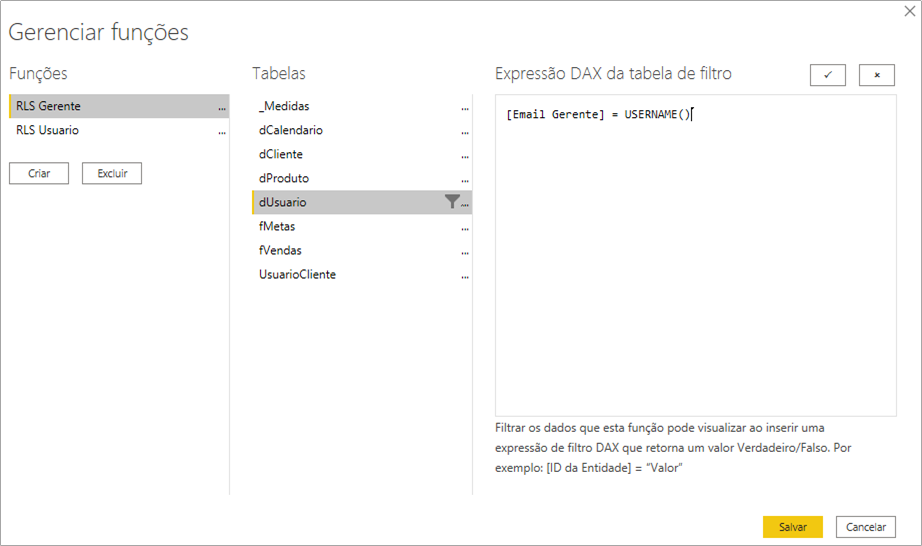
Image 55: Filter applied
DAX Formula:[Email Gerente] =
USERNAME ()
Steps:
In "Modeling" select "Manage roles" → Select "Create" → Name the role → Select the dUsuario table → Select "Add Filter" → Select the [Email Gerente] column → Assign the DAX filter
And now what do we do? Yeah ….. let’s test it! Let’s test for John and see how it looks?
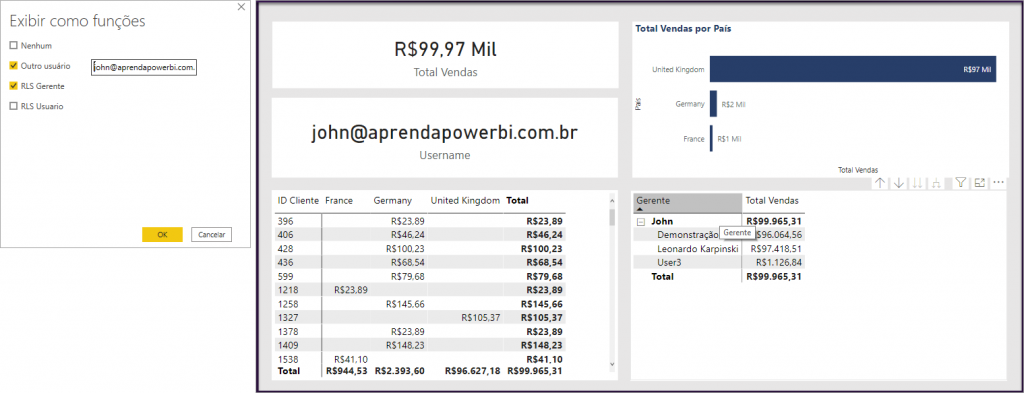
Image 56: Exhibition result for John
Steps:
In "Modeling" select "View as" → Insert the user and select the created rule
| Tip: If there was a director above the manager, for example, the logic would be very similar. Just create another role within “Manage roles” and filter the [Email Director] column as we did for the manager! So we would have 3 rules. |
| Important: Here is an important aspect to assign the correct email lists in each rule over there in Power BI Online! E-mails from managers at RLS Gerente (Manager) and users at RLS Usuario |
Data Masking
In this scenario, we are not going to do an RLS exactly. We’ll work with masking the data with measures in DAX.
Mask 1
Imagine that a user will be logged in and will be able to see yours all other managers information. However, it cannot view other users’ information with a level different than manager.
It looks a bit confusing, but the expected result would be this for visualizing as User4:
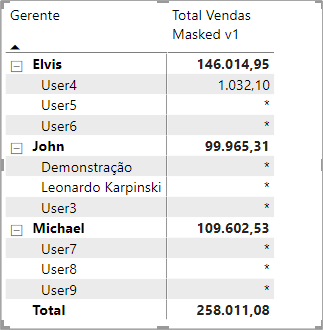
Image 57: Exhibition result for User4
This is not done through relationship and role rules, let’s create our measure:
Total Vendas Masked v1 =VAR vUsuarioContexto =
SELECTEDVALUE ( dUsuario[Email] ) // atribui o valor do email do usuário no contexto do visual para a variável
VAR vUsuarioLogado =
USERNAME () // atribui o valor do email do usuario logado para a variável
VAR vReturn =
SWITCH (
TRUE ();
HASONEVALUE ( dUsuario[ID Usuario] )
&& vUsuarioContexto <> vUsuarioLogado; “*”;
// verifica se é só um valor (para gerentes tem mais de uma valor) e se as variáveis são diferentes, se sim retorna “*” se não retorna o valor da medida de vendas
[Total Vendas]
)
RETURN
IF ( [Total Vendas]; vReturn )
With the created measure just put it in the table visual and use the “View as” to test the view for each user.
Mask 2
In the previous case, we made the measurement for the user context. If we look at the result with a customer table for the same User4:
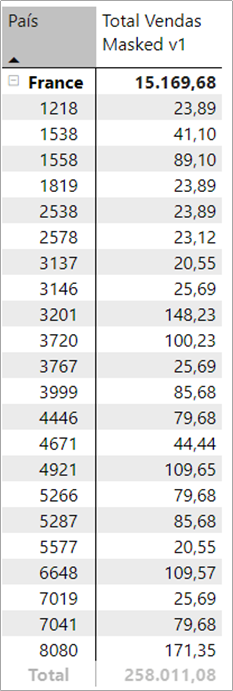
Image 58: Table with clients context
Looking from this perspective, no filter is applied because the condition we put in the measure for mask 1 was only for the user. So, let’s create a new measure that shows only the results of User4’s customers and put a “*” for the other customers:
Total Vendas Masked v2 =VAR vUsuarioContexto =
SELECTEDVALUE ( dUsuario[Email] ) // atribui o valor do email do usuário no contexto do visual para a variável
VAR vUsuarioLogado =
USERNAME () // atribui o valor do email do usuario logado para a variável
VAR vClientesFiltrados =
CALCULATETABLE (
VALUES ( UsuarioCliente[ID Cliente] );
dUsuario[Email] = USERNAME ()
) //cria uma tabela virtual com os clientes do usuário logado
VAR vReturn =
SWITCH (
TRUE ();
HASONEVALUE ( dCliente[ID Cliente] )
&& NOT ( SELECTEDVALUE ( dCliente[ID Cliente] ) IN vClientesFiltrados ); “*”;
//verifica se está no nível de cliente e se aquele cliente não está na tabela virtual criada, caso não esteja atribui “*”
HASONEVALUE ( dUsuario[ID Usuario] )
&& vUsuarioContexto <> vUsuarioLogado; “*”;
// verifica se é só existe um valor (para gerentes tem mais de uma valor) e se as variáveis do contexto de usuário e usário logado são diferentes, se sim retorna “*” se não retorna o valor da medida de vendas
[Total Vendas]
)
RETURN
IF ( [Total Vendas]; vReturn )
Well, all done … but what about the result? Let’s put this measure next to the first one in the table with customers:
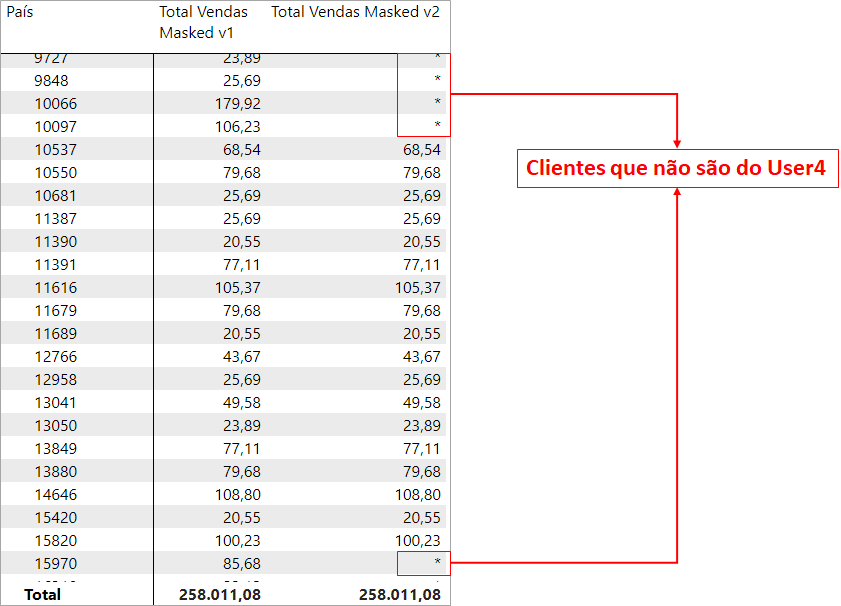
Image 59: Table with the 2 measures for comparison
Mask 3
So, complicated? Easy? Cheer up, have a drink, coffee, read again and let’s continue! The final challenge with the mask is to show the total just for the user’s customers. Look again at the result of the previous table:
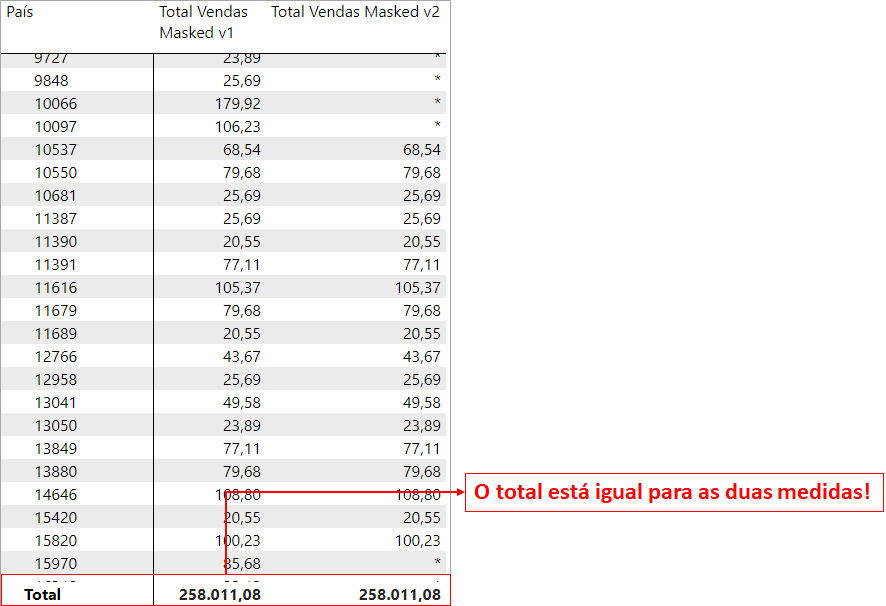
Image 60: Result with equal Totals
To change the result of the total, we have to create a new measure:
Total Vendas Masked v3 =VAR vUsuarioContexto =
SELECTEDVALUE ( dUsuario[Email] ) // atribui o valor do email do usuário no contexto do visual para a variável
VAR vGerenteContexto =
SELECTEDVALUE ( dUsuario[Gerente] ) // atribui o valor do Gerente no contexto do visual para a variável
VAR vUsuarioLogado =
USERNAME () // atribui o valor do email do usuario logado para a variável
VAR vGerenteLogado =
LOOKUPVALUE ( dUsuario[Gerente]; dUsuario[Email]; USERNAME () ) // busca o valor do Gerente do usuario logado e atribui o valor para a variável
VAR vTotalGerente =
// Calcula o total de vendas dos clientes para aquele Gerente, ou seja, o total da carteira do usuário
CALCULATE (
[Total Vendas];
KEEPFILTERS ( dUsuario[Gerente] = vGerenteLogado )
)
VAR vReturn =
SWITCH (
TRUE ();
vUsuarioContexto = vUsuarioLogado; [Total Vendas];
// se o usuário do contexto é igual ao logado retorna o valor de total de vendas para aquela linha
vGerenteContexto = vGerenteLogado
&& HASONEVALUE ( dUsuario[ID Usuario] ); “*”;
//verifica se o Gerente do usuário no contexto é igual ao Gerente do usuário logado e se existe só um valor para o usuário, ou seja, não é gerente. Retorna “*” se verdadeiro
vTotalGerente
)
RETURN
IF ( ISBLANK ( vReturn ) && [Total Vendas]; “*”; vReturn )
And the result, looks like this:
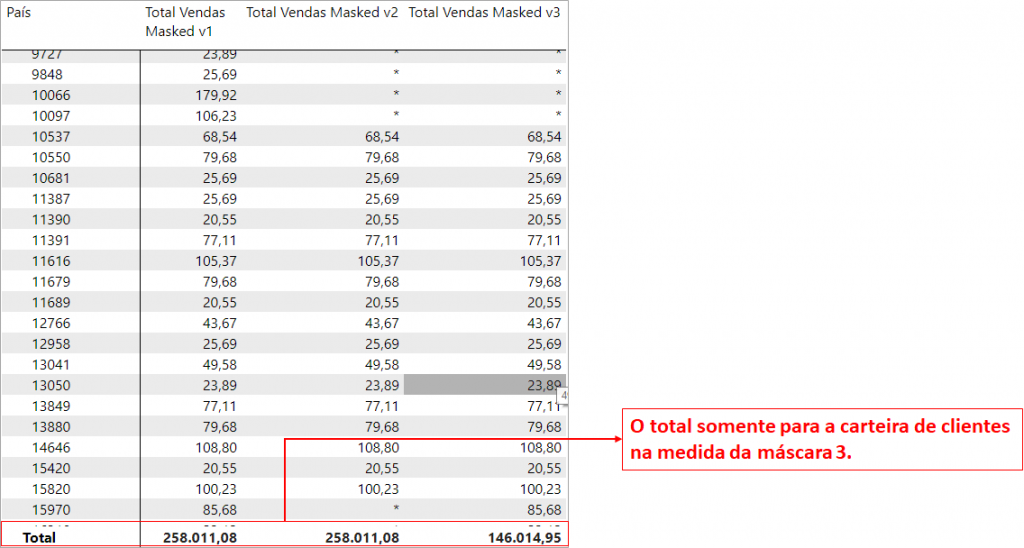
Image 61: Result with the different Totals
Page Security
This is a new feature in Power BI that allows browsing between pages in addition to the RLS, limiting the access of the pages depending on the user logged in.
The first step is to create the pages, in our case: Home, By Product (Por Produto) and By Customer (Por Cliente).
| Important: The page names must be fixed and consistent. If you change the page name after finishing the relationship, you will lose links, as the naming is not dynamic. |
After that, you create a dimension table with the report’s page information:
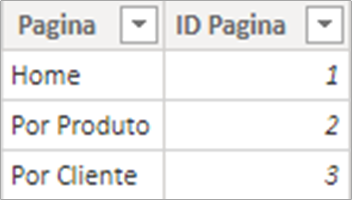
Image 62: dPagina Table
There must be a rule on which users can access which pages, and this rule is presented by the UsuarioPagina relationship table:
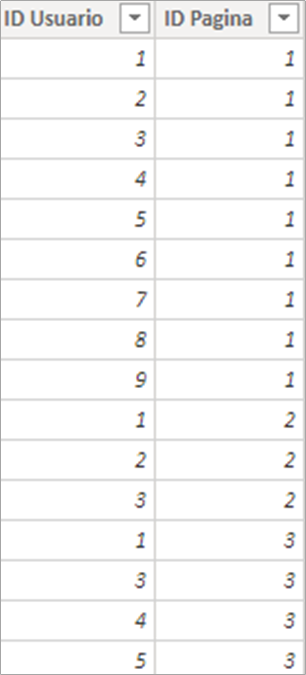
Image 63: UsuarioPagina Table
Our dUsuario table will propagate the filters in two directions. One towards the Sales (Vendas) table to filter the result presented. The other is in the direction of the dPagina table. So, the model relationship looks like this:
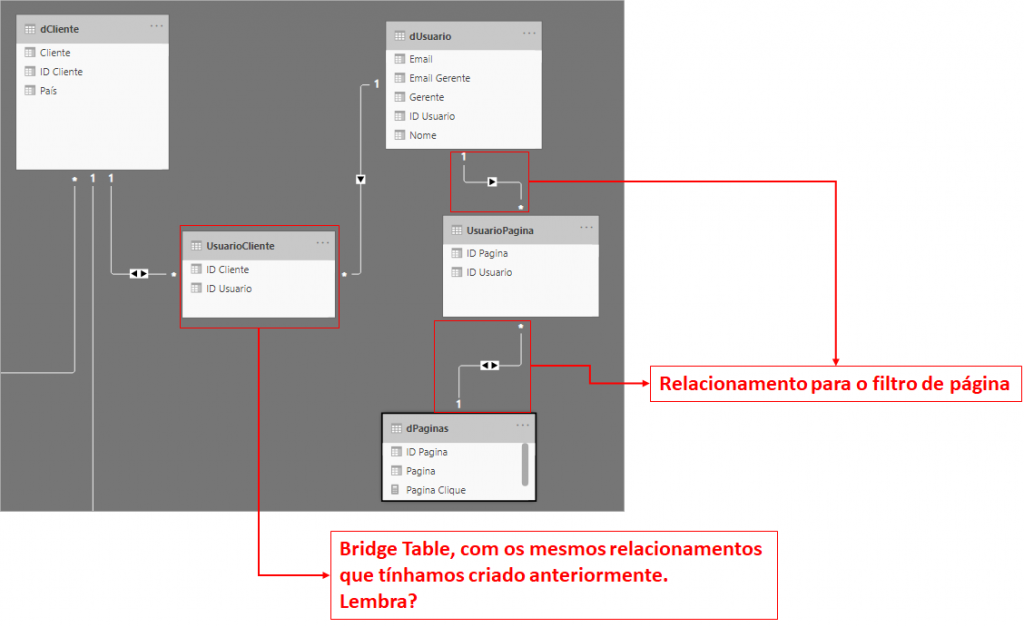
Image 64: dUsuario Relationships in the model
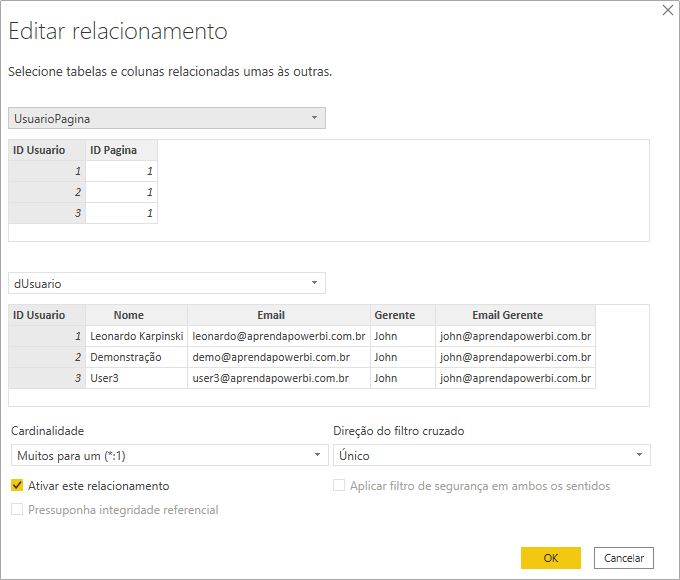
Image 65: Relationships between dUsuario and dUsuario
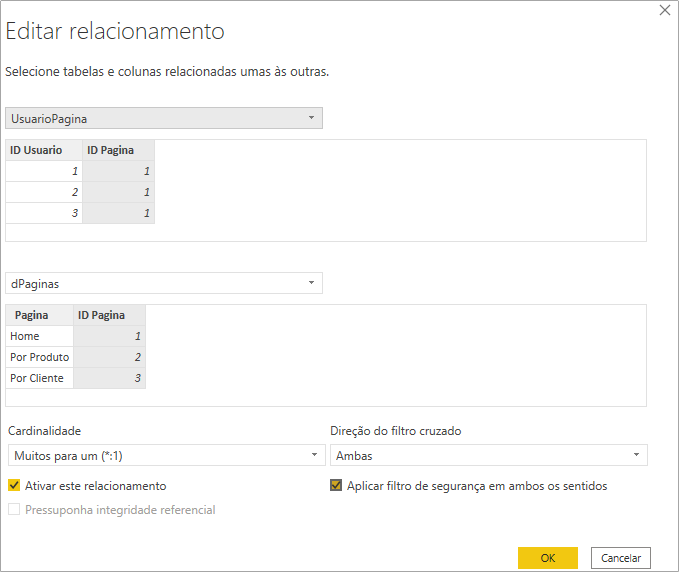
Image 66: Relationship between UsuarioPagina and dPaginas
And the last step is to create the function rule for the user, very simple as we have done for other cases:
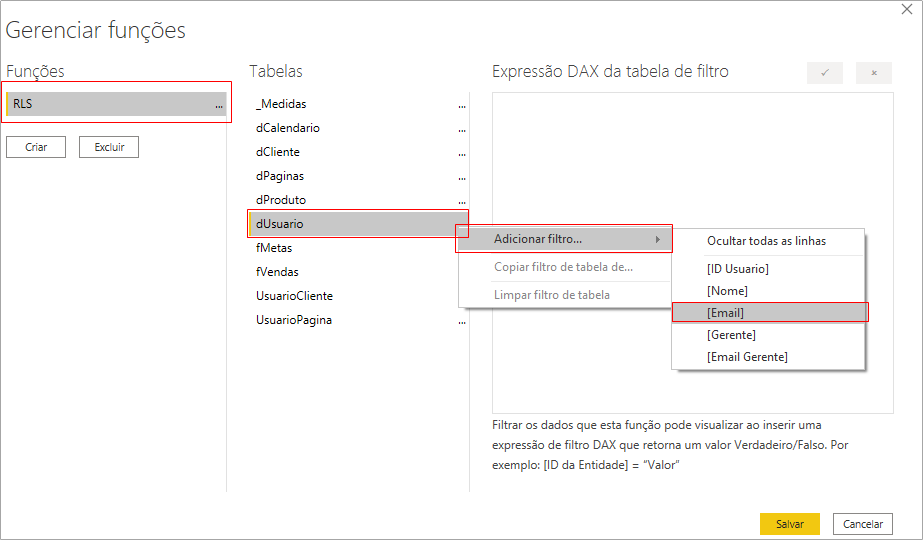
Image 67: Rule creation by e-mail
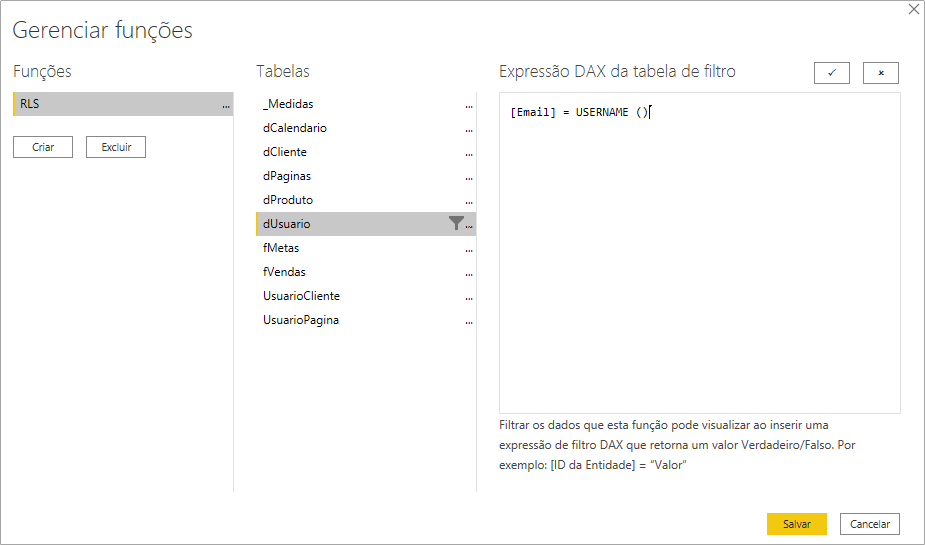
Image 68: DAX Filter application
[Email] =USERNAME ()
Steps:
In "Modeling" select "Manage roles" → Select "Create" → Name the role → Select the dUsuario table → Select "Add Filter" → Select the [Email] column → Assign DAX filter
And now, shall we test? First for the famous User4:
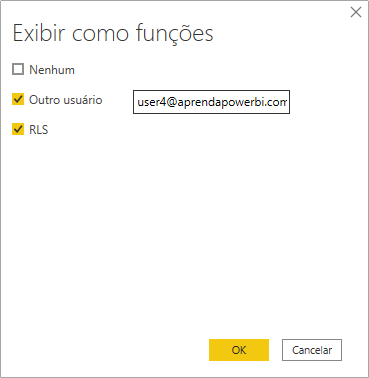
Image 69: User selection for exhibition
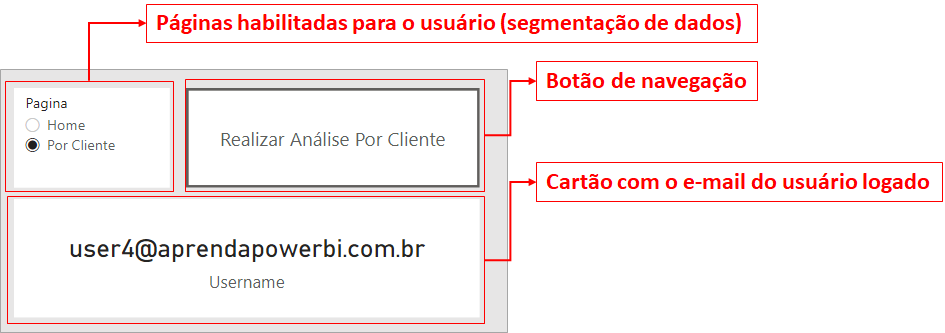
Image 70: User4 Home Page
Steps:
In "Modeling" select "View as" → Inser the user and select the created rule
Note that the analysis page by product does not appear for User4, as there is no such relationship in the UsuarioPagina table. And if we go to the by customer analysis page:
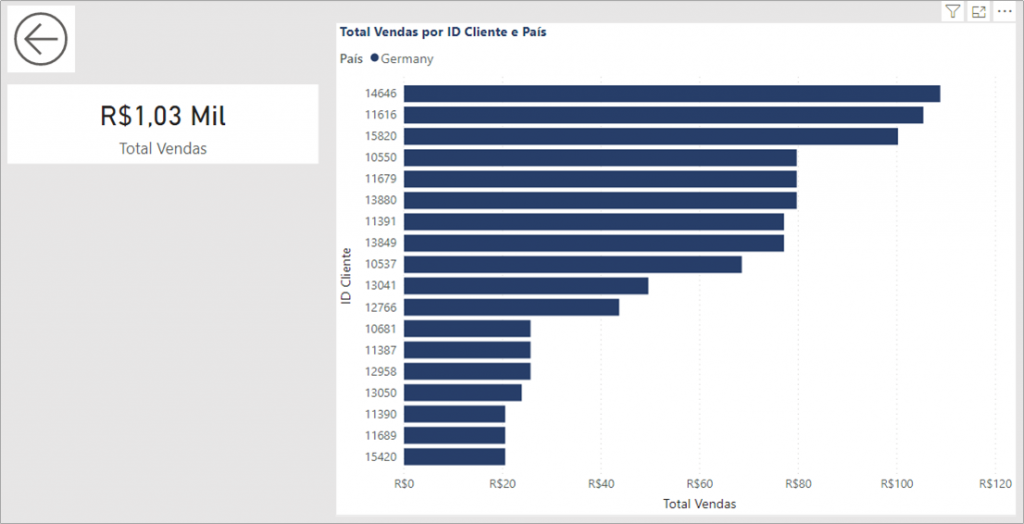
Image 71: User4 by Client (Por Cliente) Page
Also, let’s do the test for my user who has access to all information and pages:
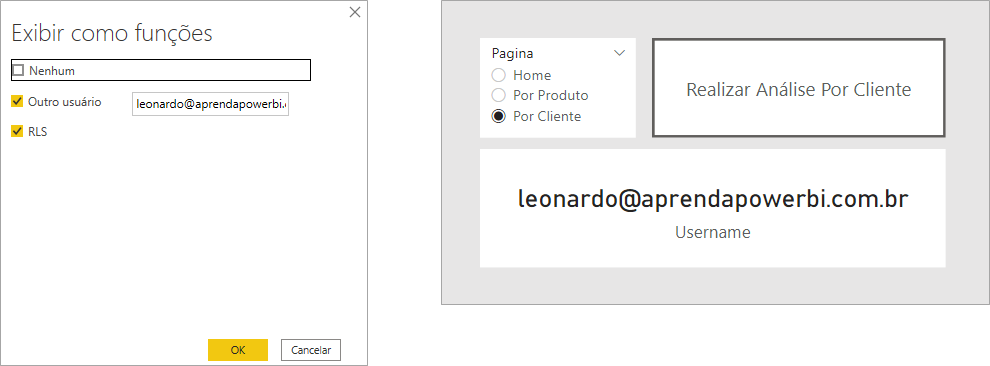
Image 72: Filter and Page for the user Leonardo
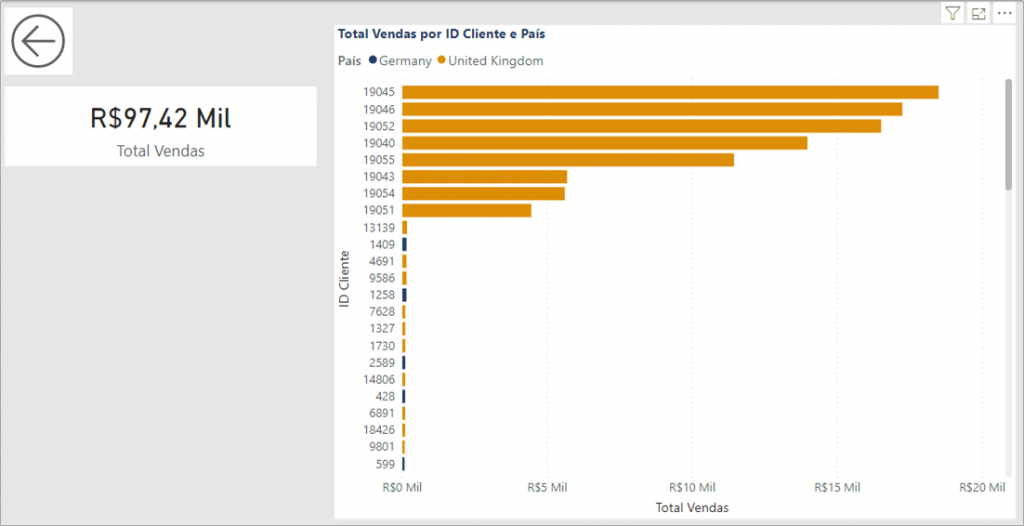
Image 73: By Client (Por Cliente) analysis result
I showed the usage, but it lacked the creation of the button for navigation and the measures that will be used in it:
Measures:Pagina Destino =
SELECTEDVALUE ( dPaginas[Pagina] )
// trás o valor da página selecionado na segmentação de dados para a medida
Pagina Clique =
IF ( [Pagina Destino] = “Home”; “Home”; “Realizar Análise “ & [Pagina Destino] )
// caso a página selecionada for Home mostra Home mesmo,se não adiciona o texto de “Realizar Análise” antes
And editing the button looks like this:
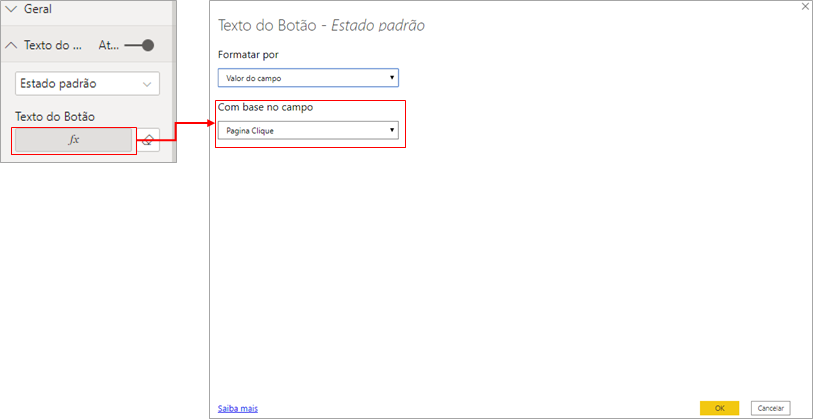
Image 74: Dynamic Text edition for the button
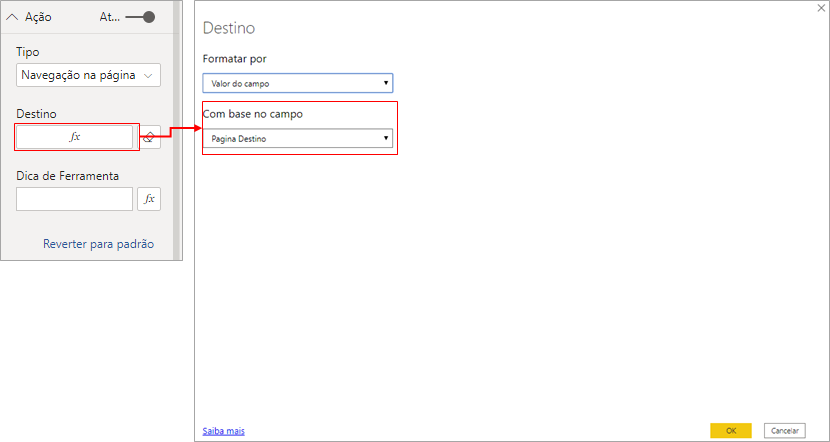
Image 75: Navigation edition for the button
With that, we finish our last example!
I would also like to share an article that Arthur de Oliveira wrote about RLS and Dynamic Navigation:
Take a look because it’s quality material!
Guys, that was the content of Live # 29 !! I believe I have covered everything about RLS, column and page security and I hope it will be very useful in your daily life! I do not consider it a simple matter depending on the application, but I am sure that by following the step by step you will understand.
If you have questions or suggestions for next Lives topics, you already know, you can leave them in the comments.
Regards,
Leonardo