Finally! Incremental Refresh no longer requires Premium capability! Today’s content is not just about how to use this feature! We’ll go deeper! You will understand what is behind this function. In addition, I will give you tips to help you faster develop your report and not fall into trouble!
We will talk about:
1. How to make development faster
2. How to configure the Incremental Refresh
3. Aspects to be careful about in order to ensure the Incremental Refresh works
4. How to visualize the partitions when connecting to the Online Dataset
Fast Development
A lot of people complain about the time spent on development both in Power Query and reports. What I always ask is: are you developing the report with its entire database?
You don’t need to develop the report with the whole database, but only a sample of it. Who needs the complete database is the end-user in the online service – after you publish the report.
With that said, we will show how to work with data samples using parameters.
Importing queries
We will perform an example using a database stored on my own machine. This database has data from 2005 to 2014.
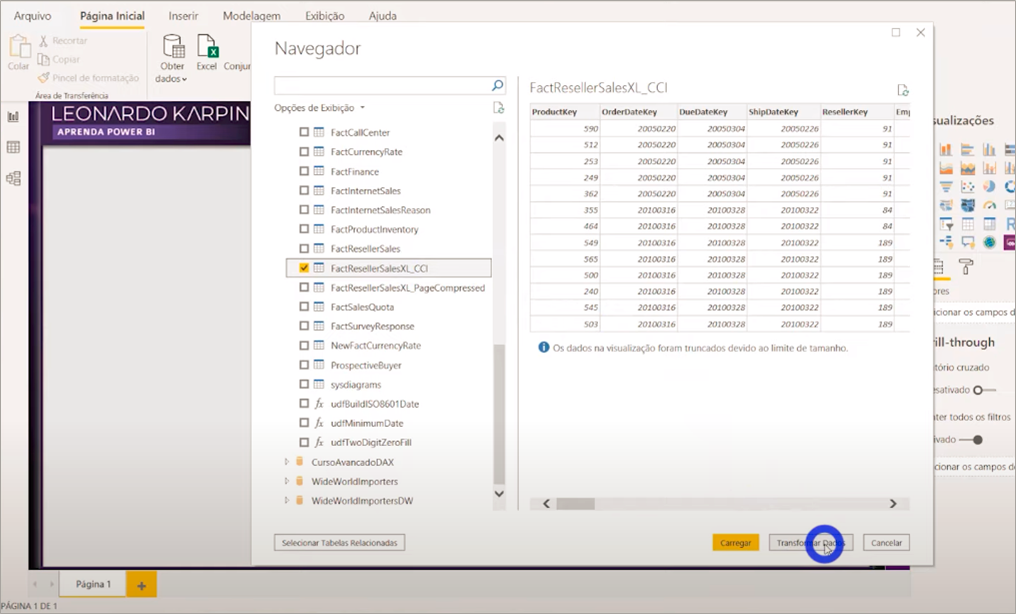
Let’s import the FactResellerSalesXL_CCI table from the database following the steps:
Steps:
1. Home
2. Get Data
3. SQL Server database
4. Enter the server name (localhost)
5. Select the Data Connectivity Mode: Import
6. Select the FactResellerSalesXL_CCI table
7. Transform data
After clicking Transform data the first thing you should do (always) is to choose columns in Power Query (PQ), see below:
We chose these 3 columns above for testing purposes and the base has no filter. By clicking on Close and Apply and then saving the file, we are left with a 20.2 MB .pbix.
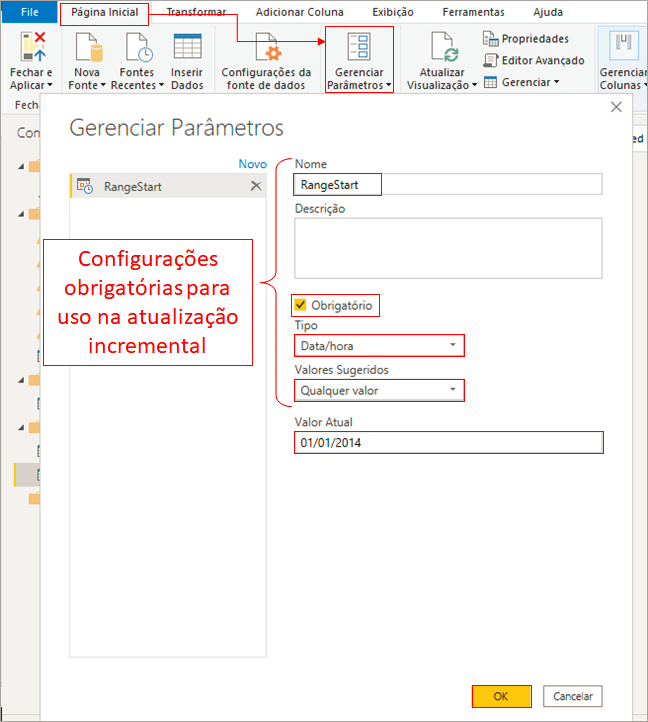
Creating parameters
We are going to create two parameters: RangeStart and RangeEnd. They must be configured with these names (written exactly like this) and type of value (Date/time) so that we can use them in the Incremental Refresh settings, ok ?!
To create the parameter in Power Query, click on Manage Parameters (on the Home tab):
To quickly create the other parameter, copy and paste the RangeStart, rename it to RangeEnd and change the Current Value (Valor Atual in the above image) to 01/01/2020, as shown below:
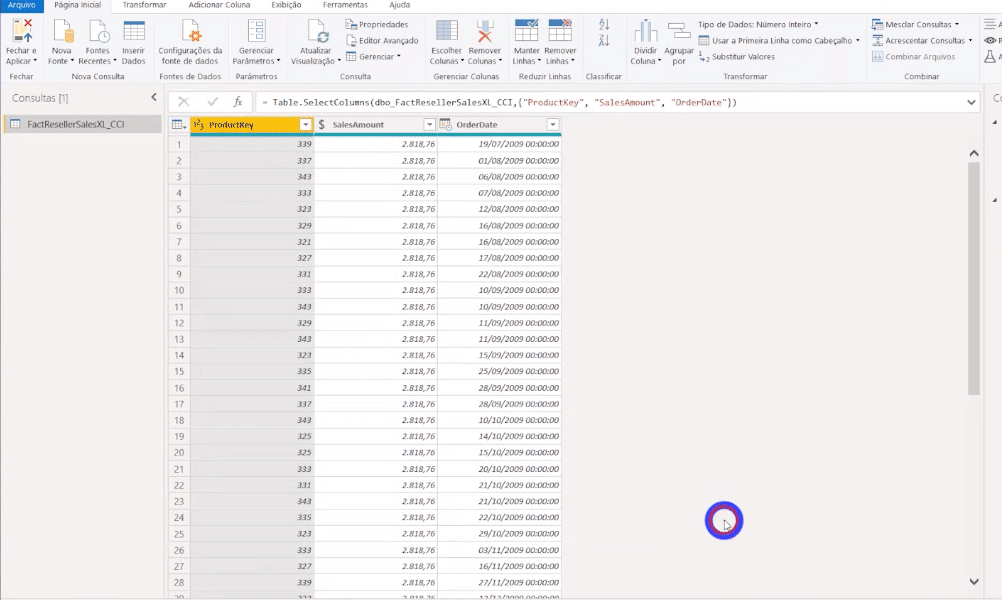
Filtering the Fact Table
Utilizaremos aqueles parâmetros que criamos para filtrar a tabela fato.
Steps:
1. Select the dropdown button in the OrderDate column
2. Date/Time Filter
3. is after or equal - parameter - RangeStart
4. is before - parameter - RangeEnd
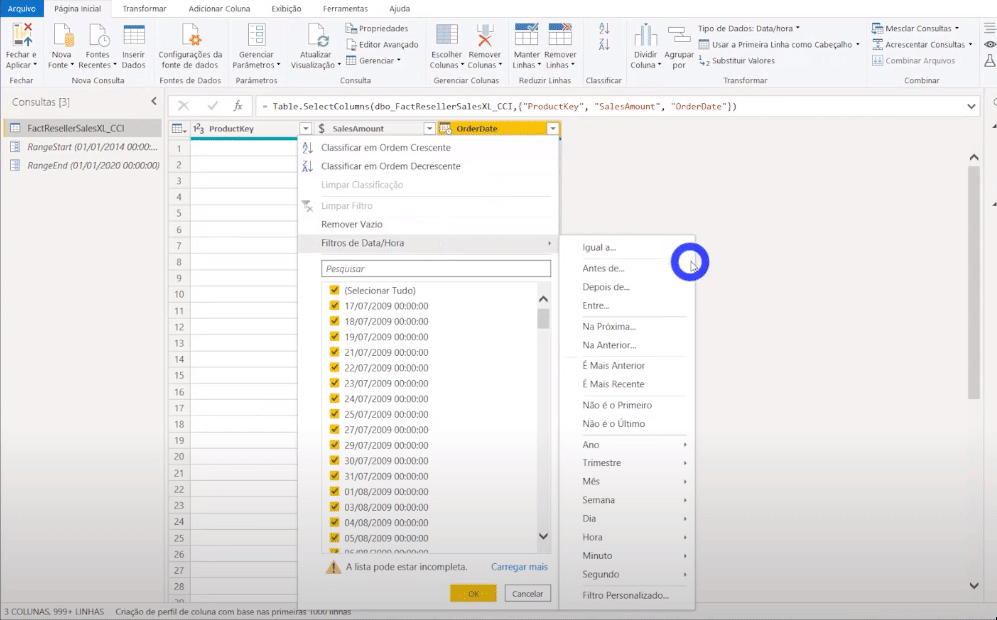
Note that it doesn’t make sense to filter the dimension tables, ok? The factual table is our ‘bottleneck’ – the largest table that slows down development. The more data you import, the slower development gets.
After clicking Close and Apply and saving the .pbix file, its size was reduced from 20.2 MB to 2.8 MB.
All set! We managed to make development much faster!
What is Incremental Refresh? Who can perform it?
It is a feature that allows part of the data in your reports to be updated, which means, only what has changed in your database will be updated. With this feature, the process of updating will be faster, with reduced resource consumption, and will occur more reliably. The idea behind this is to partition the data model. The news is that even if you only have a PRO account you will be able to leverage this functionality!
The main strategy for using the Incremental Refresh is: update only what you need! An important detail: it will not work with every type of database. The first rule is: we need a server on the backend. It is useless to try an incremental refresh in a CSV or Excel file because the partitioning in the database will not work.
Important:
You must have a PRO account and the most up-to-date version of Power BI to use the Incremental Refresh feature
How to configure the incremental refresh
The first step was already implemented when we defined the RangeStart and RangeEnd parameters.
To configure the Incremental Refresh, you must go to Reports, right-click on the fact table and fill in the requested fields as follow:
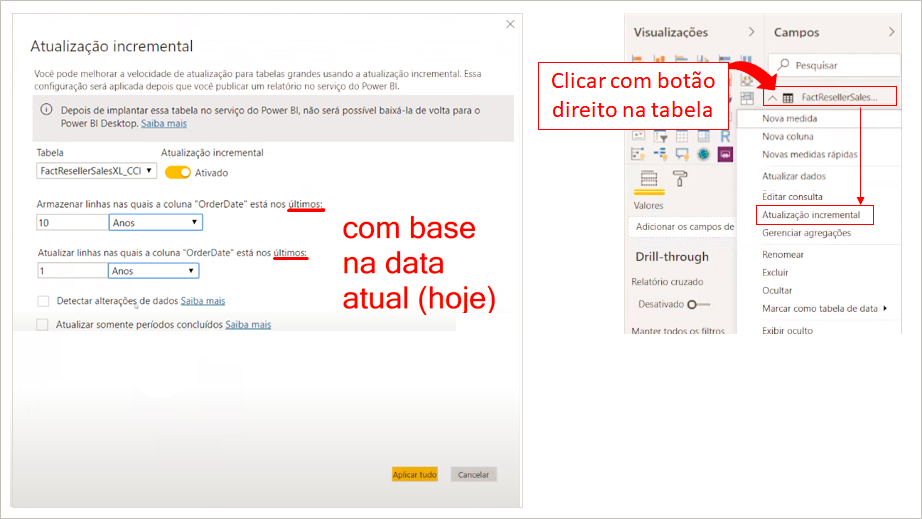
In this example, we are indicating to PBI that we want to keep only the last ten years stored – which means, from 2010 (remember that our database has data since 2005?). We also indicate that we only want data for this year (2020) to be updated.
When we enter “1” in the second dropdown, we are stating that we only want updates from Jan / 2020 until the last available date. This is different from entering “365” days, okay ?! Both settings are in relation to today’s date, ok ?!
Note that you have an option to select another date column when you check this checkbox:
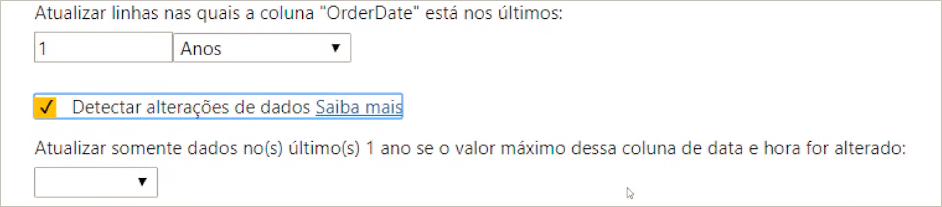
This option will apply if you have an Update Date column, which means, a date that represents when that row was updated. Then, PBI will check if there was a change in this column (in this 1 year we specified above). If so, it will update the database. This option makes the update a little faster. Since we don’t have this column, we will leave this unchecked.
Note that we also have the option to update the data only if the years are complete. Notice that we insert “1” year and if we check the checkbox presented above, we won’t have our 2020 data updated because we haven’t finished 2020 yet, ok ?! We will then leave this option unchecked.
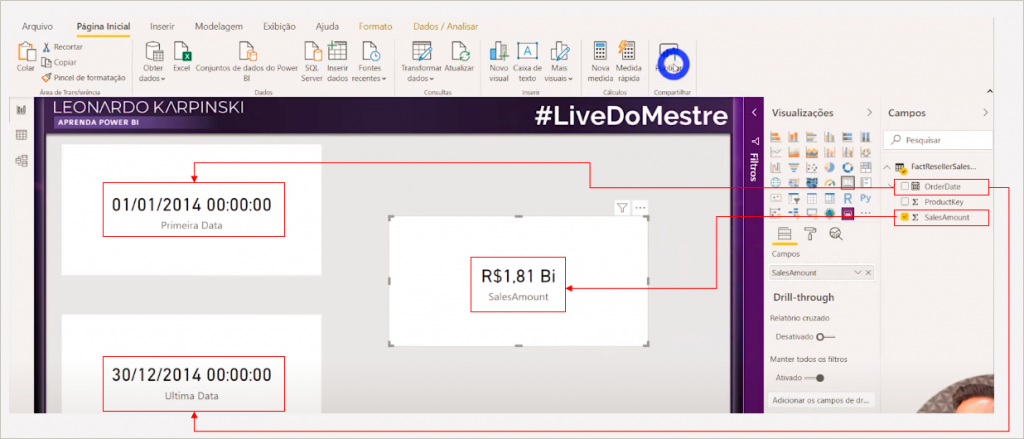
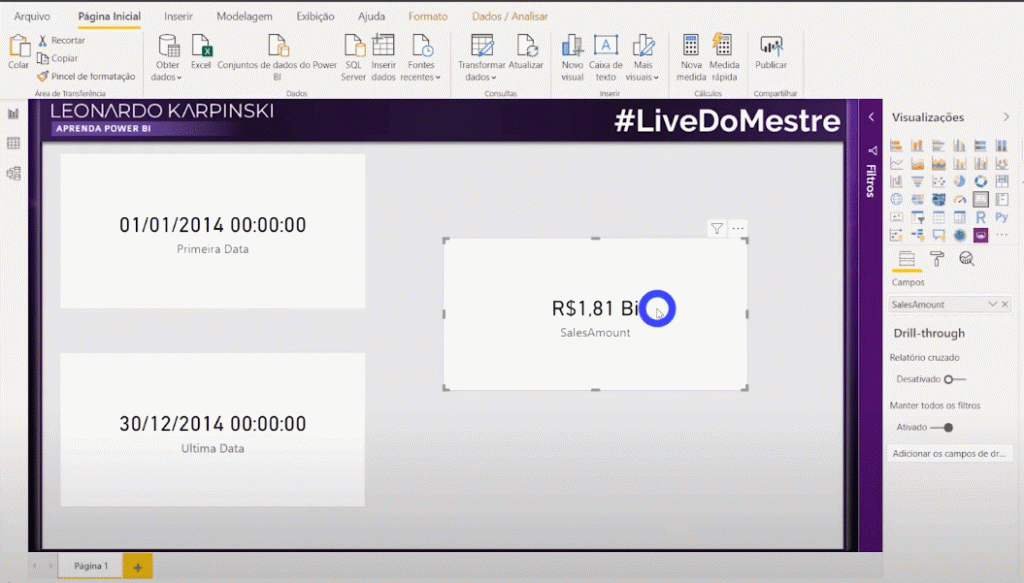
Report
Let’s add three cards to the page containing the values of OrderDate (first and last) and SalesAmount:
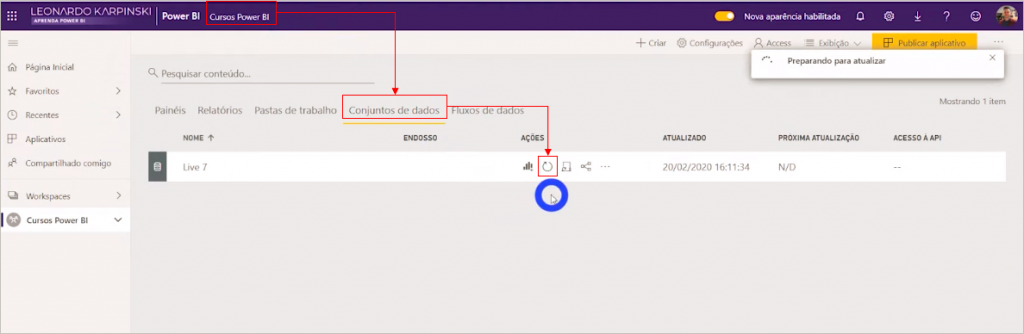
Publishing the Report
When we publish the report on PBI Online we will see exactly this page we created with the cards:
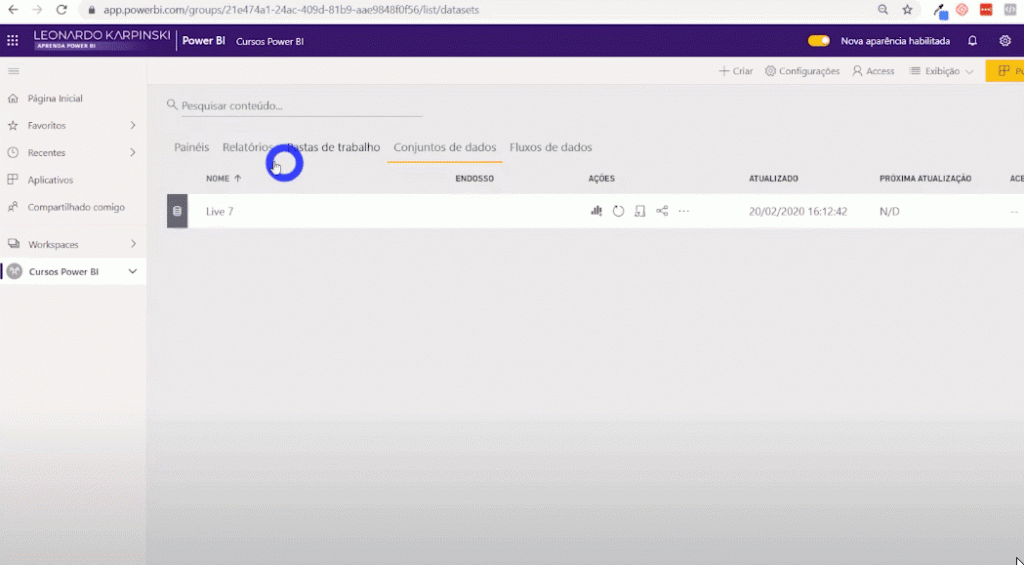
To update, just go to Dataset and click the update button:
After completing the update and clicking Reports, you will be able to see the updated report.
If the updated data is not displayed go to the three dots and click update:
Note that the card with the last date shows 2014 because we only have data up to that year. That is, if we had data for 2020 and had PBI update the report again, we would notice that the dates would be updated along with the SalesAmount value. However, if there was any change in value before 2010, this value would remain the same since we have defined that only the last year (current year) would be updated.
Precautions to ensure the operation of the Incremental Refresh
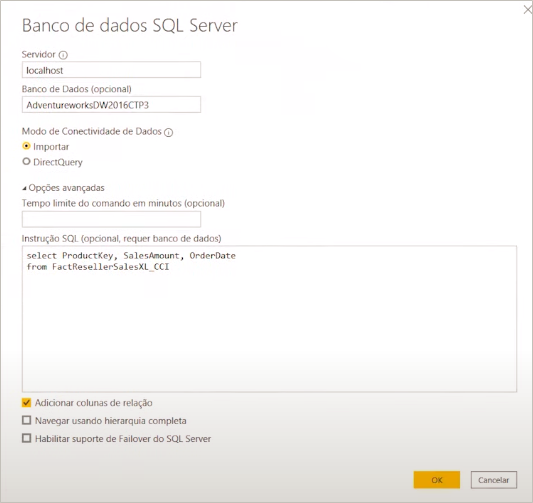
Let’s say that instead of importing that table as we did a little earlier, you want to import the data using an SQL statement. To do this you must click Get data and select the SQL Server database. Then enter the following instruction:
When we filter the OrderDate column using the RangeStart and RangeEnd parameters in the same way as we did before, we will see that it will take much longer to update the data.
What happens is that when applying transformations in Power Query after writing a query to connect the data, you lose Query Folding.

What happens is that PBI is unable to send a native query to the server so it needs to bring everything into memory and then apply the filters. Because of this additional step, updates to tables without Query Folding will be slower than the original ones.
If we make the following change to the M language code, our problem will be “solved”. Compare the code before and after:
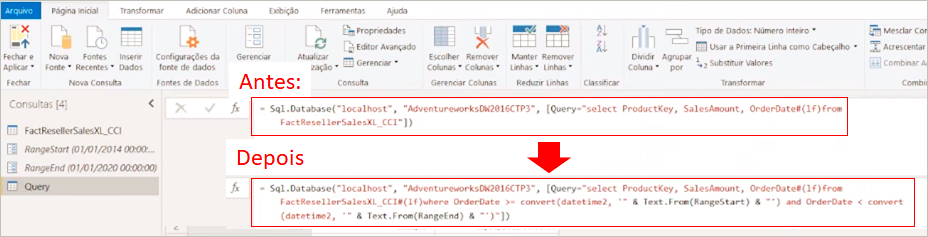
Ready! By doing this, the speed will be identical to the example we did without the SQL statement, ok ?!
How to visualize partitions Connecting to the Online Dataset
Now, let’s show you what happens behind the Incremental Refresh. I must first activate the dedicated capacity in Power Bi Online:
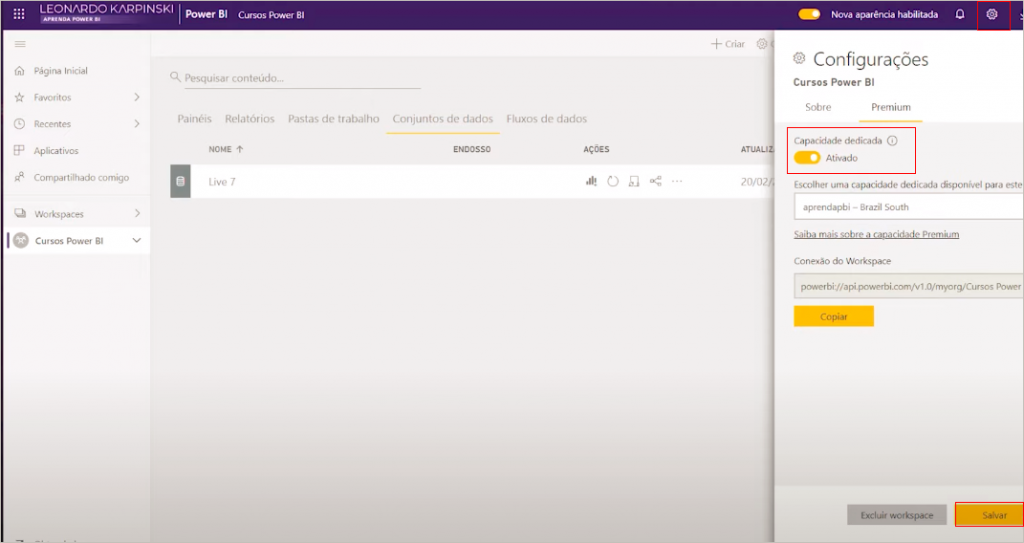
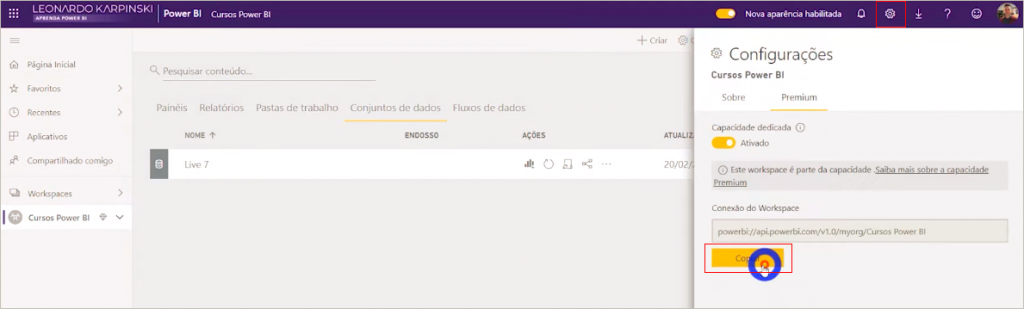
After clicking save, you will need to copy the link in order to connect to Workspace (premium):
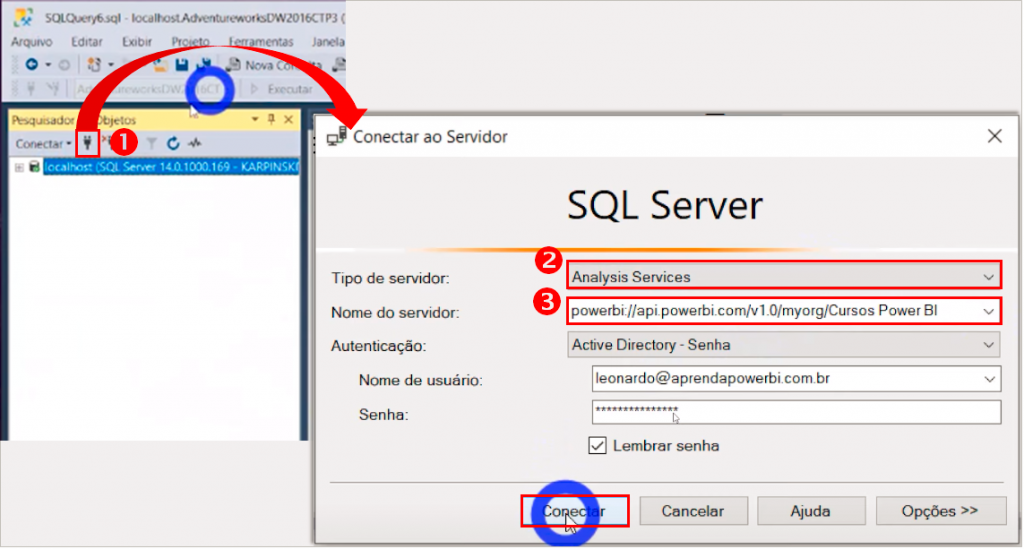
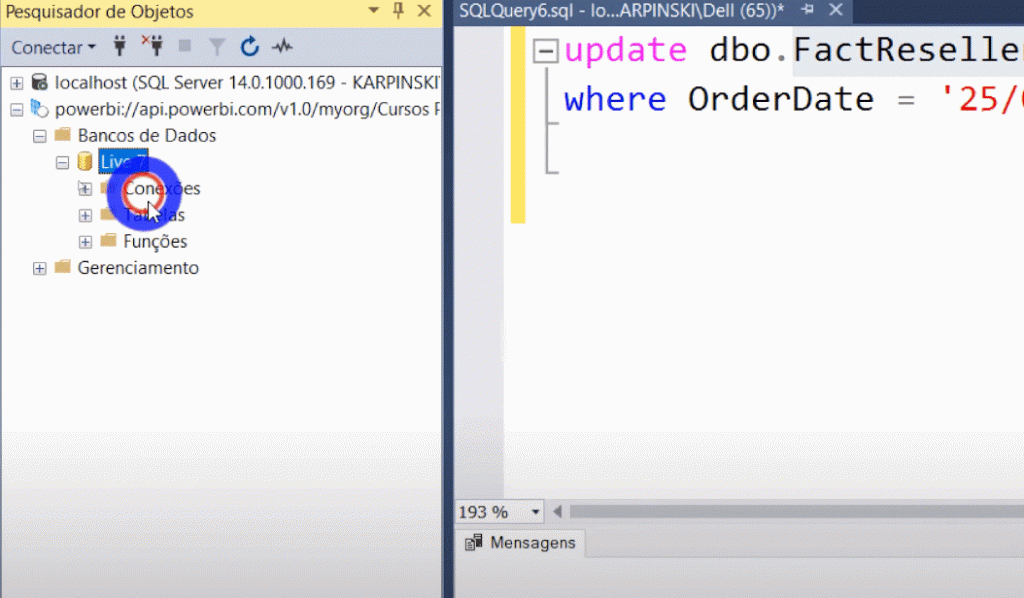
After that, in SQL Management Studio we will connect to this ‘source’ we copied, see below:
We must expand that fact table (by right-clicking on it) and then selecting “Partitions“:
Look how nice this table with partitions is:
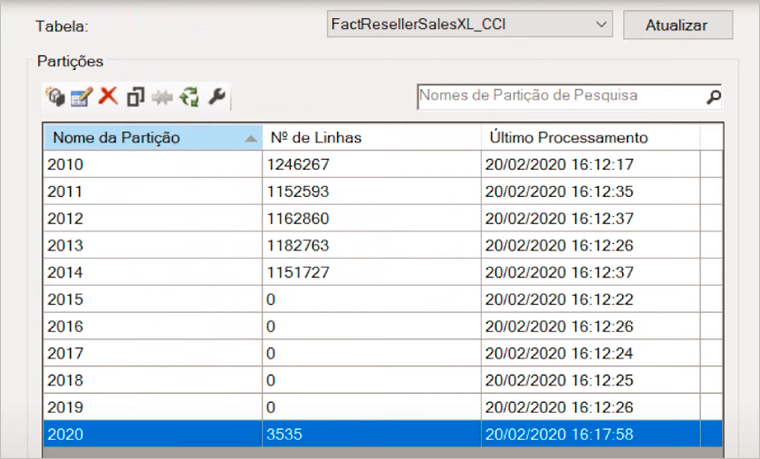
You may be wondering about this line with “2020”. I created, for testing and demonstration purposes, values and dates of “2020” to prove what I said before: when updating the data, only the last (1) year will be changed (ie 2020). The rest will remain unchanged. Through the Last Processing column, you will be able to see that this is exactly what happened behind the Incremental Refresh!
The data from 2010 to 2019 remained with the update time at around 16:12 while the line representing the 2020 partition has a time around 16:17.
Well folks, this article was based on Power BI Live # 7. I hope you enjoyed it.
Regards,
Leonardo.