Hi guys!
On this lesson I will talk about the DAX Language, what is the filter and row context, and I will show the CALCULATE function works. But first, I will show you that as important as DAX is the Data Model. You must have a well-designed data model in order to get the most out of DAX.
Last but not least, the big secret to have your measures much easier.
All my videos tend to be longer than usual because I like to go deep on the matter so you can learn for real.
Before we start, don’t forget to subscribe to the Power BI Week. A free and online event where I teach everything I know about Power BI! You don’t want to lose this opportunity!
Hope ypu enjoy! Let’s get started!
On our first lesson, we talked about the 7 pillars for mastering Power BI, and on this second lesson, we are going to talk about more specifically of the fourth pillar: Calculation. Which means we are going to talk about, the DAX Language.
Although there is no way to talk about calculation without talking about first of Modeling! That is an important step!
Where does data come from?
The data we use in Power BI, usually comes from a database. A database is an organizational collection of data, usually stored and accessible electronically from a computer system. When databases are more overly complex, they are often built using a formal design and modeling method.

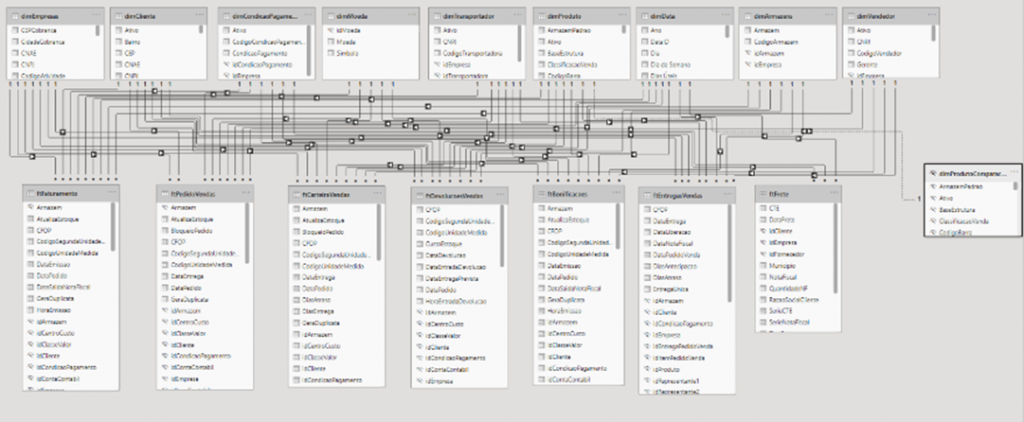
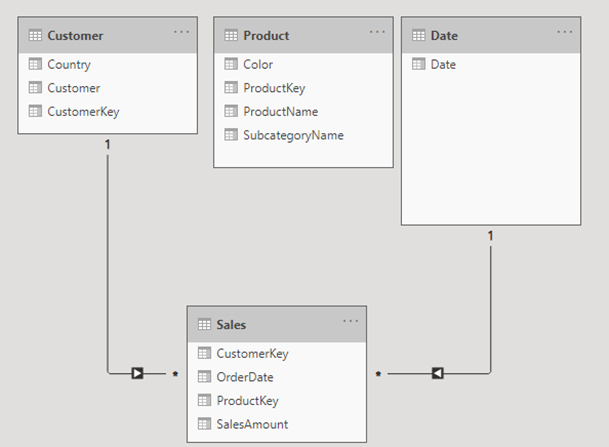
In this example, we can see that there are some tables, so the first thing to do is to relate them, in this way you can optimize the tables you will import to Power BI.
This usually happens when a big number of data is imported from the company system. In excel this is common to have a table with a lot of columns (flat table), which is not good to use in Power BI.
Tip: You should never import the database directly to Power BI!
Just to contextualize the subject, a dimension is a table that describes a business entity, the items you model. That includes products, people, locations, and concepts, and sure, time.
They are the “look up tables” where you have the information such as, who, when, where and what. So, whenever you want to describe something, the information is stored in dimension table.
Fact table stores observations or events. A fact table contains dimension key columns related to dimension tables and numeric measurement columns.
In general, dimension tables have a small number of lines. The fact tables, on the other hand, can have a large number of lines and keep growing as time goes by.
Whenever you have dimension tables connected to each other it is a Snowflake Schema. This schema integrates the source tables into a single model table.
In general, the benefits of a single model table exceed the benefits of several model tables. The most ideal decision may depend on data volumes and usability requirements for the model.
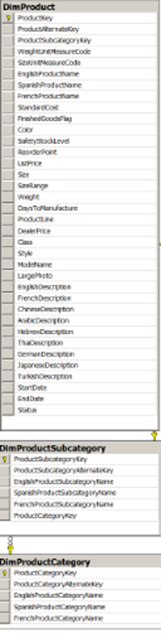
Tip: When you have dimension tables connected, you have to put them together as one single table, but never put the columns of dimension inside the fact tables!
Although there is a better way (specially visually) to put the dimension columns together, using the Star Schema.
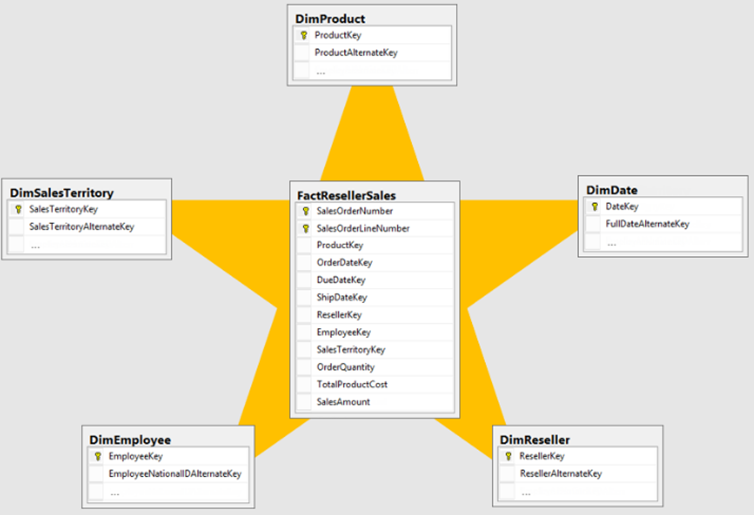
Figure 3 – Star Schema
They have dimension tables connected to fact tables instead of connecting to other dimension tables.
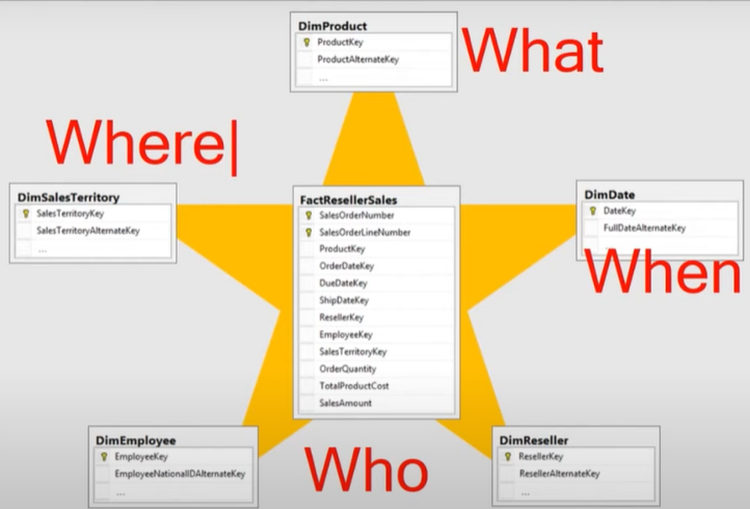
Other examples we can use, is the Dimensional Model. The relationship always goes from the top to the bottom (from dimension to fact tables).
Tip: Always try to build a Dimensional Model in a Star Schema. There is no exception!
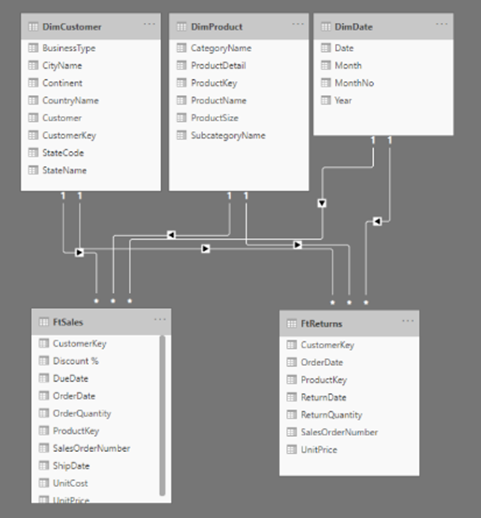
It is also possible to use it when you have a lot of tables! Check it out:
Tip 1: If you are stuck in a measure, if you can’t write properly, check your model first. The problem might be in the model and not in the DAX measure.
Tip 2: All dimensions should have a unique column, which is the Primary Key of the table.
Creating tables and measures
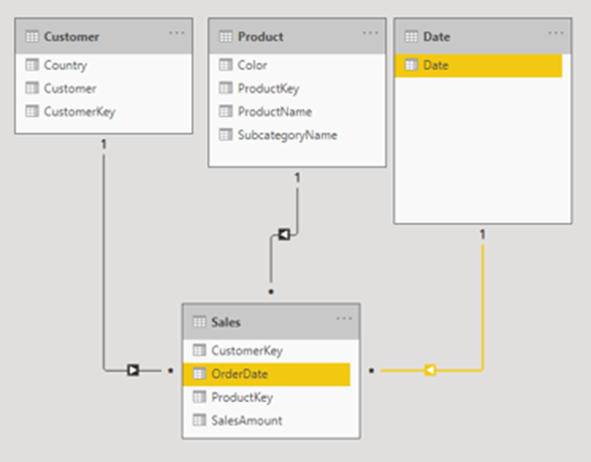
Let’s begin with the figure below:
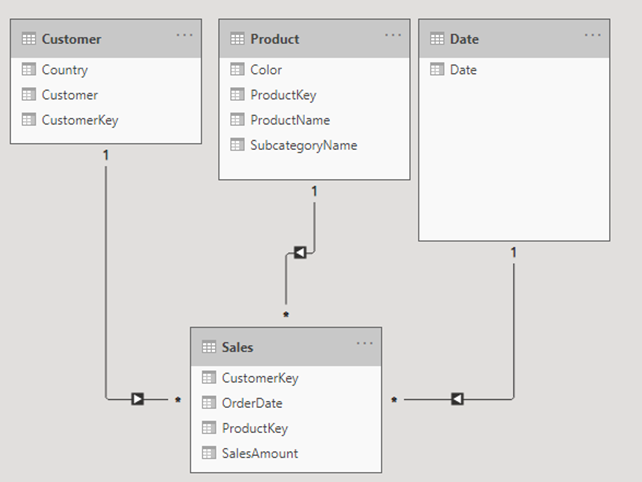
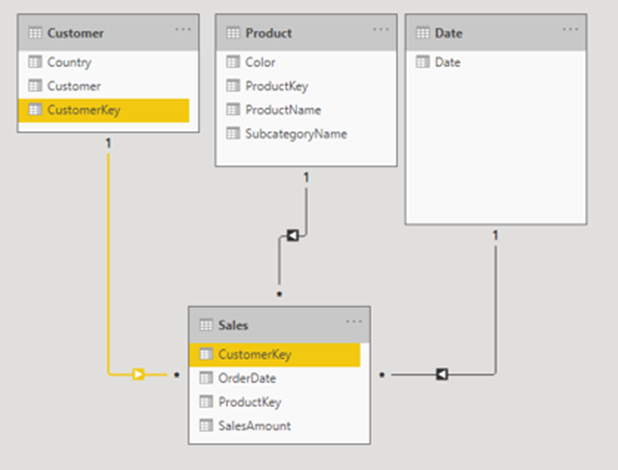
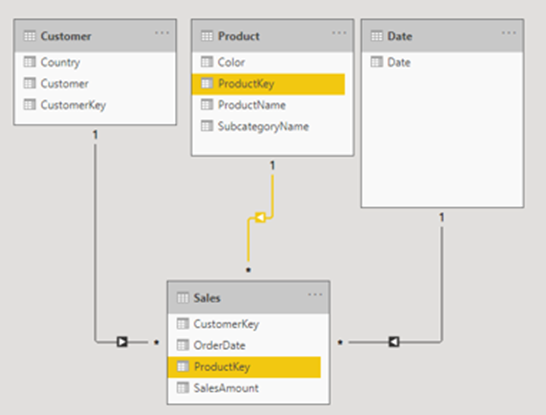
We always must have the relationship between the dimension to the fact table.
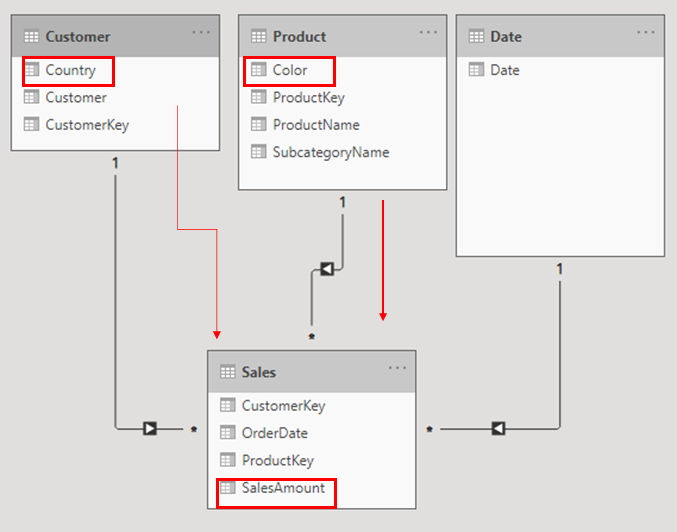
The number 1 represents that there is only 1 value per row.
Whenever we use a column in “Values” its automatically summed up. You can change it in case you don’t want to sum the values. Although this is not the best way to work with measures.
Let me show you the right and best way to do this!
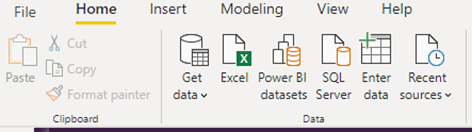
On the toolbar, click on “Enter data”, then a new window opens.
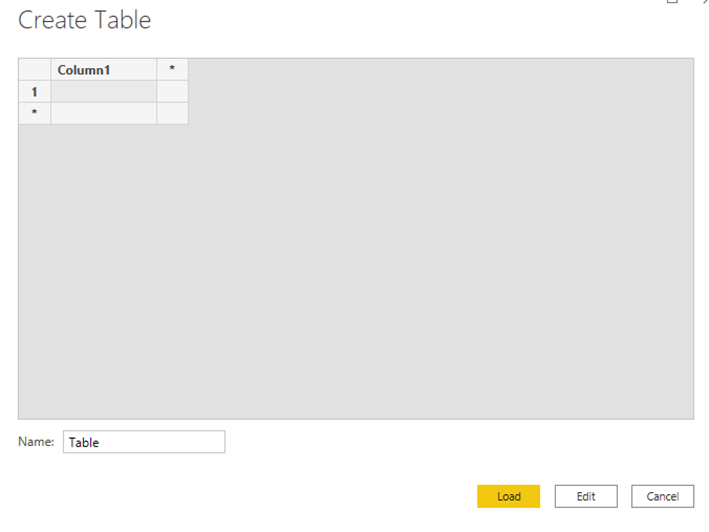
You can rename the table if you want.
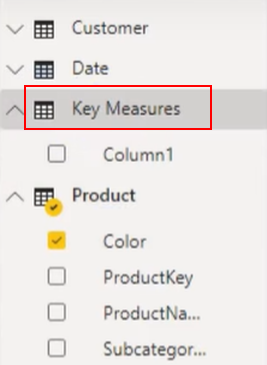
Once you create a table, on your right you can see in “Fields” the new table.

SUM ( Sales[SalesAmount] )
Per what you could see in the video, there are 2 measures: implicit and explicit. I will give you 3 reasons why the explicit measure is better:
- You can use it along with other measures;
- You must always use a measure instead of a column when you use “Values”;
- Any measure store data within them.
That is a difference we can highlight between Power BI and Excel. In Excel we are used to create columns, whereas in Power BI we must ALWAYS use measures when it is related to math.
Data Modeling and Filter Context
A relationship is a filter that goes from a dimension to a fact table.
If you remove the relationship between the tables, the information will automatically disconnect.
One more comparison we can make between Excel and Power BI is when we have some tables in Excel and we want to connect (relate) them, we will use a function called “VLOOKUP” and “XLOOKUP”. In Power BI we have the relationship, that has the same function as the others, but in an easier way to connect tables.
Once you master the concept of data modeling, it will be even better for you to work with bigger models with more tables.
Other considerable difference between Excel and Power BI is that you cannot reference a cell in Power BI like you can in Excel (D11, E8, F5). In Power BI we refer as column and only.
A filter context is a filter that is applied to the report and flow across the relationships.
So, we can understand that a filter context defines which rows are visible in the fact tables.
DAX – Data Analysis eXpression
Filter x Row Context
Filter Context is the combination of all filters that are applied on the report, which propagate through the relationships. Doesn’t iterate, but filters.
Row Context is when we create a calculate a calculated column. The values are calculated for each detail row. Doesn’t filter, but iterates.
Using the example that was given in the video, we can use:
SalesAmountFixed =Sales[SalesAmount] / 2.0
If you copy this function and create a new measure, you will see that is not possible, because there won’t be a reference row. In this case, a function that aggregates the column will be necessary.
SalesAmountFixed =SUM ( Sales[SalesAmount] ) / 2.0
Also, is possible to use another function:
SalesAmountFixed =SUMX (
Sales,
[SalesAmount] / 2.0
)
Although in this case it won’t be necessary to use because it can do the sum first and the division later.
Calculate Function
It is the only function that can modify the evaluation context.
Using the example used in the video to exemplify:
Total Sales Germany =//Shift + Enter
CALCULATE (
[Total Sales],
Customer[Country] = “Germany” // FILTER(
// ALL(Customer[Country]),
// Customer[Country] = “Germany”
// )
)
In this case the filter used was “Germany”. If we don’t want to apply a specific filter, we use the function “KEEPFILTERS” just like this:
Total Sales Germany =//Shift + Enter
CALCULATE (
[Total Sales],
KEEPFILTERS ( Customer[Country] = Germany )
)
Another nice function to use is the “ALL” one. This function removes the filters from the table mentioned. In the example “Product”.
You can create a measure and in the function tab use:
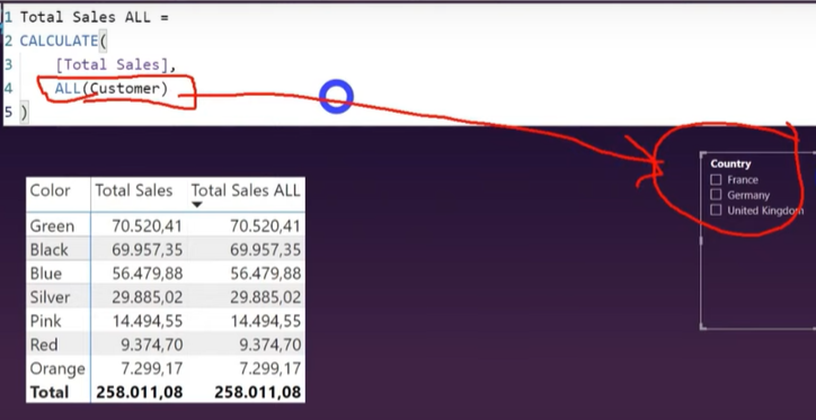
Total Sales ALL =CALCULATE (
[Total Sales],
ALL ( ‘Product’ )
)
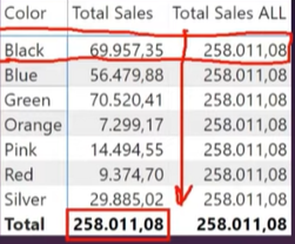
Note that when we use the function “ALL” we void the other filters that was used before.
Whenever you use “ALL” function that is applied on the same table as another filter, the function will not make any changes.
This function is extremely specific, so you must pay much attention when using it!
As mentioned in the video, when you are using the tables in the “ALL” function, that is coincidentally your dimensional tables, is the same as deleting the filters from the fact table (in the case of the example).
Total Sales ALL =CALCULATE (
[Total Sales],
ALL ( ‘Sales’ )
)
To know the percentage of the total you have to use the function (note that you can create a new measure or not):
% GT =DIVIDE (
[Total Sales],
[Total Sales ALL]
)
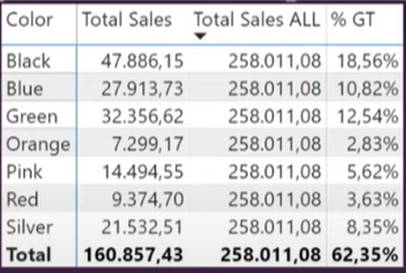
There is another function that we can use the same way for “ALL”, which is “ALLSELECTED” but this last one keeps the filter from outside, meanwhile “ALL” doesn’t keep.
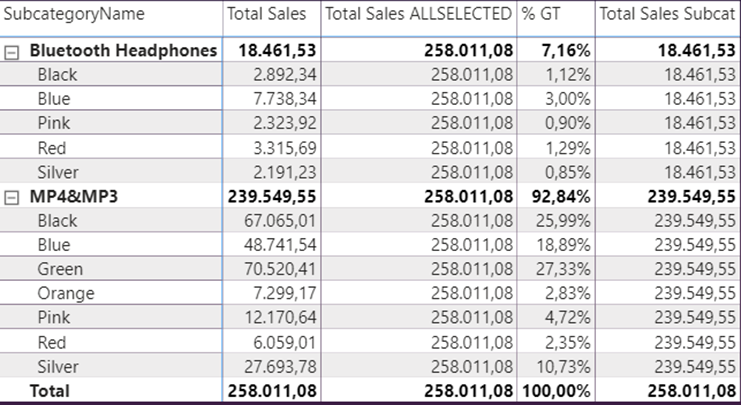
What if we want to compare different values? Let’s create a new measure and name it “Total Sales Subcategory”.
Take a look:
Total Sales Subcat =CALCULATE (
[Total Sales],
ALL ( ‘Product’ ),
VALUES ( ‘Product'[SubcategoryName] )
)
And what if I want to combine 2 different tables? Let’s suppose I want to know the value representation of “MP4&MP3” in Germany:
Total Sales by Country =CALCULATE (
[Total Sales],
ALL ( Product[Subcategory Name] )
)
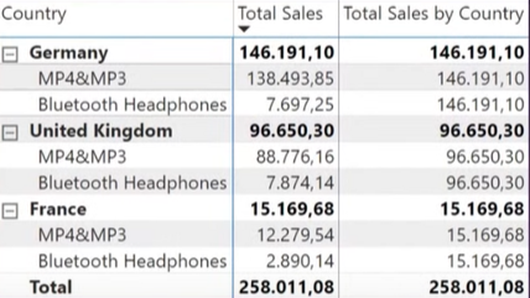
Or we could have used:
Total Sales by Country =CALCULATE (
[Total Sales],
ALL ( Sales ),
VALUES ( Customer[Country] )
)
This one is actually the safer way to make sure it will work the way you need.
That’s it for today, guys!
We’ve learned important things such as function from DAX Language, calculate function (“ALL”, “ALLSELECTED” and “KEEPFILTERS”).
There are other functions that I will teach you later! Hope you liked this video and learned more about Power BI!
And don’t forget, every Thursday I release a new video.
Cheers,
Leonardo