Hey guys!
Welcome back to our weekly lesson.
Today we will talk about percentage. Advanced DAX with the CALCULATE function. This is the most important function in the DAX Language and the most powerful. So, you need to understand how it works to perform advanced calculations in Power BI.
This lesson will only be available for 7 days, so be sure to watch before it goes offline. Materials will be shared only in my Telegram channel.
Before we get started, let me share some important notes with you:
- My videos in English has a [EN] as tag in the beginning of the video title;
- Every Thursday there will be a new Live session here on Youtube at the same time;
- Lessons will stay Public only for 7 days;
- After this, the videos go to the course as a Bonus to the students of Power BI eXperience;
- Lessons #1 to #4 will stay public and you can check them in the playlist in the description below;
- Materials will be shared only in my Telegram channel;
- The greatest new of all: Second edition of Power BI Week on January 4th to 8th;
- In the Blog you can find several articles that will help you even more with Power BI. Including our lessons here that will be also an article.
Hope you enjoy it!
Remembering the 7 pillars of Power BI
The 7 pillars for Mastering Power BI
- Extraction (the data from the source)
- Transformation
- Modelling (create table relationships)
- Calculation (where we build KPI’s)
- Visualization
- Distribution (publishing)
- Automation
Today we are going to talk about pillar number 4 – Calculation (DAX: Data Analysis eXpressions).
Filter x Row Context
Filter Context is the combination of all filters that are applied on the report, which propagate through the relationships. Doesn’t iterate, but filters.
Row Context is when we create a calculated column or when we use iterative functions (like SUMX). The values are calculated for each detail row. Doesn’t filter but iterates.
Let me show you an interesting function called “DISTINCTCOUNT”.
How can I calculate the number of products that was sold for each country?
Let’s starting by creating a new measure:
Products Sold =DISTINCTCOUNT ( Sales[ProductKey] )
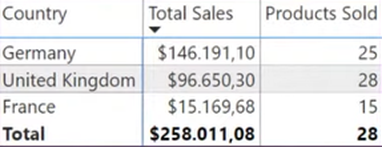
You can see that the total value is not the sum of all values, right? That is because the total is evaluated in a different filter context. Which filter context? The whole table!
CALCULATE function:
– It is the only that can modify the filter context;
– Syntax: CALCULATE( <expression>, Filter 1, Filter 2, … );
– Filters are tables.
To exemplify let’s create another measure:
Total Sales Red =CALCULATE (
[Total Sales],
‘Product'[Color] = “Red”
)
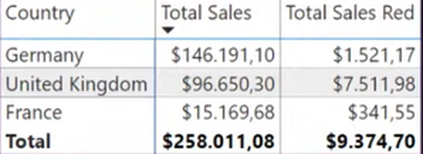
If we filter by “blue” the values won’t change since we used “Red” as filter in the measure.
Another nice function to use is “ALL”. This function removes the filters from the table mentioned.
You can create a measure and in the function tab use:
Total Sales Red =CALCULATE (
[Total Sales],
//’ Product'[Color] = “Red”
FILTER (
ALL ( ‘Product'[Color] ),
‘Product'[Color] = “Red”
)
)
I will create another measure to make sure you guys understand:
Total Sales ALL =CALCULATE (
[Total Sales],
ALL ( ‘Product'[Color] )
)

Did you notice anything different regarding the values? Yes, the amount is equal for all colors in “Total Sales ALL” column.
Whenever you use “ALL” function that is applied in the same table as another filter, the function will not make any changes.
Now let’s see the percentage:
% Total Sales =DIVIDE (
[Total Sales],
[Total Sales ALL]
)
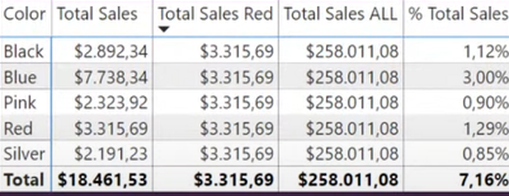
Now we have the percentage of the “Total Sales”.
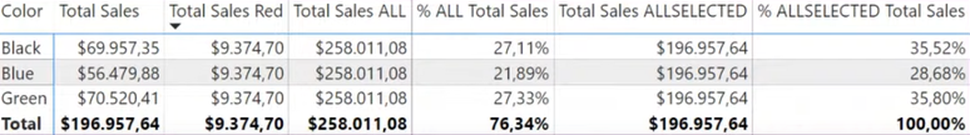
There is another function that we can use the same way for “ALL”, which is “ALLSELECTED” but this last one keeps the filter from outside, meanwhile “ALL” doesn’t keep.
Total Sales ALLSELECTED =CALCULATE (
[Total Sales],
ALLSELECTED ( ‘Product’ )
)
Now, just as we did for the function “ALL” we will do for “ALLSELECTED” with the percentage:
% ALLSELECTED Total Sales =DIVIDE (
[Total Sales],
[Total Sales ALLSELECTED]
)
Okay, now let’s create another matrix with “SubcategoryName” and “Total Sales”, adding “Total Sales ALL” and “% ALL Total Sales”.
You realize that the percentage values are related to the values of “Total Sales ALL” column, right? Now what if I want to compare the value of “Blue” for “MP4&MP3” in “Total Sales” with the total amount of the same column? In order to do so, we have to consider the filter in the “SubcategoryName” column. That’s what we are going to do:
Total Sales for SubcategoryName =CALCULATE (
[Total Sales],
ALL ( ‘Product’ ),
//ALL removes filter from the table or columns passed as argument
VALUES ( ‘Product'[SubcategoryName] )
)
You can see that after applying the function, the values in “Total Sales for SubcategoryName” are the same as the total in “Total Sales”. For us to create another percentage we will have to divide “Total Sales” with “Total Sales for Subcategory Name”.
% Total Sales by Subcat =DIVIDE (
[Total Sales],
[Total Sales for SubcategoryName]
)

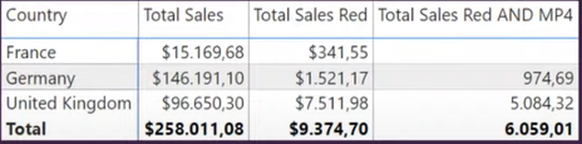
What do you think about applying two filters in a measure? Let’s make this happen!
Since you can’t reference multiple columns in one single statement. That being said:
Total Sales Red AND MP4 =CALCULATE (
[Total Sales],
‘Product'[Color] = “Red”,
‘Product'[SubcategoryName] = “MP4&MP3”
)
If I want to filter by one or the other (in this case “Red” or “MP4”) we must use:
Total Sales Red OR MP4 =CALCULATE (
[Total Sales],
FILTER (
ALL (
‘Product'[Color],
‘Product'[SubcategoryName]
),
‘Product'[Color] = “Red”
|| ‘Product'[SubcategoryName] = “MP4&MP3”
)
)
Tip: When you are filtering a column, try to use as a smaller number of columns as possible.
Tip: When you have multiple filters, they’re evaluated by using the “AND” logical operator, which means that all conditions must be TRUE at the same time.
I can use Boolean expressions that return TRUE or FALSE if I follow these rules: Reference only a single column; Not reference measures; Not use functions that scan or return a table that includes aggregation functions like SUM, MAX, etc.
To create a date table you have two options:
1) In Power Query
Or
2) Using DAX (Modeling option in the tool bar)
Date =CALENDARAUTO ()
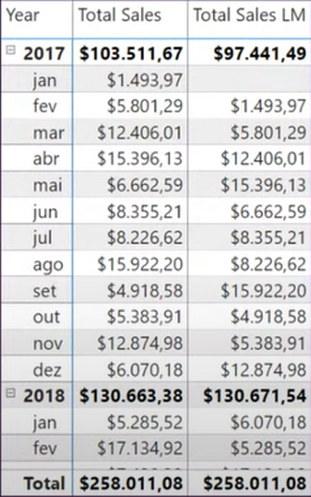
We created our table and now we want to compare the amount of February with January. How can we do this comparison?
Let’s start by creating a new measure:
Total Sales LM =CALCULATE (
[Total Sales],
DATEADD (
‘Date'[Date],
-1,
MONTH
)
)
Now if I want to do the same with the “Year” information:
Total Sales LY =CALCULATE (
[Total Sales],
DATEADD (
‘Date'[Date],
-1,
YEAR
)
)
Now let’s make some examples for cumulative sums, “Year to Date” just like in the example:
Creating a new measure:
Total Sales YTD =CALCULATE (
[Total Sales],
DATESYTD ( ‘Date'[Date] )
)
According to the example used, how can we have the first day of the calendar among other dates? We need to use the function “ALL” to be able to use all the “Date” table, but we don’t need all the months, how can we work with it? It’s simple! Just have to filter up to March.
Cumulative Sales =VAR vLastDate =
MAX ( ‘Date'[Date] )
VAR vRT =
CALCULATE (
[Total Sales],
ALL ( ‘Date’ ),
‘Date'[Date] <= vLastDate
)
RETURN
vRT
For today that’s it, guys!! There are more links to help with what we talked about today:
https://docs.microsoft.com/pt-br/dax/distinct-function-dax
See you next Thursday!!
Cheers,
Leonardo