Have you ever had to work with hours in Power BI? Did you struggle with it? Did you read this post’s title and got confused because someone told you this wasn’t possible ?! Then follow along and I will show you in detail how to work with hours in the hh: mm: ss format, how to drill down on dCalendario (dCalendar) until the seconds layer and more!
Scenario
We will work with a Production Case – suggested by a student of the complete course. We will work with a very simple fictitious database, just to show the procedure.
Database
Our database consists of an Excel file with a fact table called fProducao. It has columns with information on each operation performed by each operator. We have two columns in hh: mm: ss format indicating the start and end date/time of each operation.
Initial restrictions
The biggest problem I identified in this scenario is trying to work with the time data in hh: mm: ss format. PBI doesn’tallow it! We will need to work with decimals!
Tip:
It is not possible to perform sum, average or any other type of arithmetic with data in hh: mm: ss format in Power BI.
In our Canal do Telegram the members also mentioned that PBI doesn’t automatically identify the duration in hours when this value exceeds 24 hours. We’ll test this example right now!
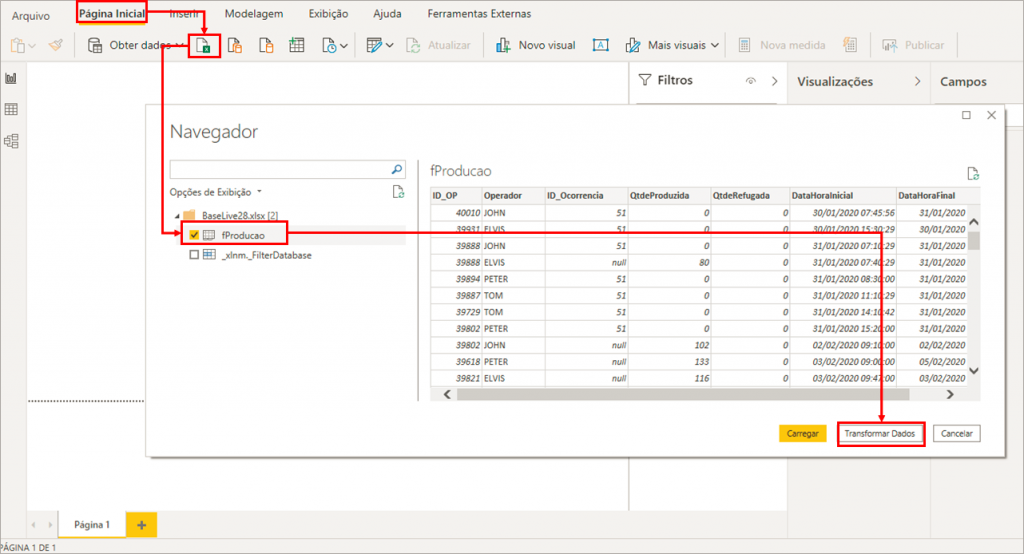
Note that PBI automatically modified the data types and this time everything was fine. See that the DataHoraInicial and DataHoraFinal columns were in the format dd / mm / yyyy hh: mm: ss, ok ?!
After checking if everything is right with our data base, click Close and Apply.
In terms of performance, I always recommend that you separate Date/Time column – a column for date and a column for time because the more distinct values a column has the worse the model’s performance – it makes it difficult to compress the columns.
When we have date and time in the same column, the number of possible combinations of these two values is much greater – that is, we will have more distinct values in that column. Always keep that in mind when working in PBI, okay ?!
Tip:
The more distinct values a column has, the less performance the model present. It is recommended to split the Date / Time column in two – one for Date and one for Time.
Initial Test
Remember the restriction we mentioned about PBI not showing the value of hours correctly when it’s greater than 24 hours? Let’s do a quick test to see what actually happens.
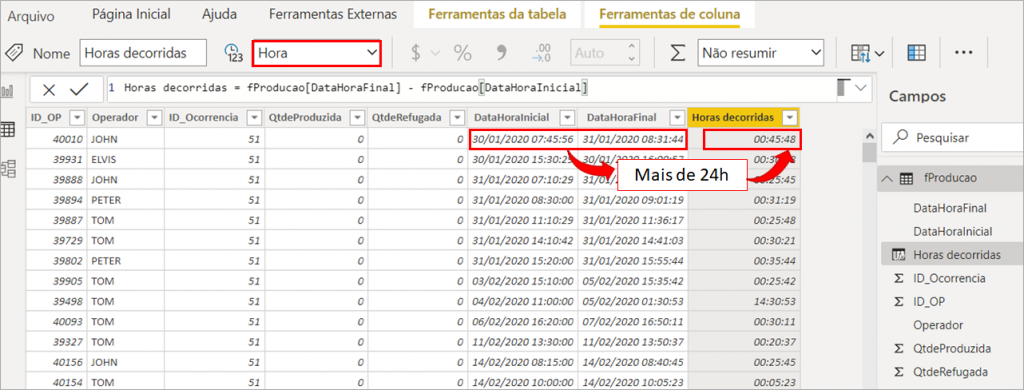
We will add a column via DAX with the hours elapsed (“Horas decorridas” in the formula below) between the DataHoraInicial and DataHoraFinal. Add a new column and enter the following formula to replicate the example:
Horas decorridas =fProducao[DataHoraFinal] – fProducao[DataHoraInicial]
After changing the type to the Hour format, you will notice that the PBI does not show values over 24 hours (the same would happen in Excel). In place it only displays the difference (minutes and seconds).
Notice the result of this formula when the value goes beyond 23:59:59:
We then need to multiply this difference by 24 and PBI will automatically convert the column to Decimal type:
Horas decorridas =24 * ( fProducao[DataHoraFinal] – fProducao[DataHoraInicial] )
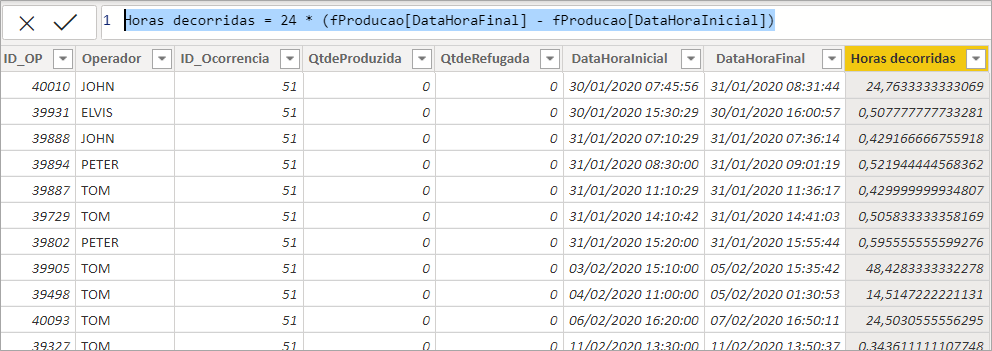
Our strategy will be to work in decimal format and only at the end go back to the hh: mm: ss format, ok ?!
That was just a test! Let’s delete this column and go back to Power Query and do what we mentioned before: work with a column for date and another column for time – to improve the model’s performance.
Transformation in Power Query
First, we will do this same calculation (subtraction) in Power Query. To do this, follow the steps:
Steps:
1. Click on the DataHoraFinal column
2. Click on the DataHoraInicial column
3. Go to Add column and in Hour, select Subtract
Piece of cake, right ?! Now we just have to transform this column using this Power Query feature:
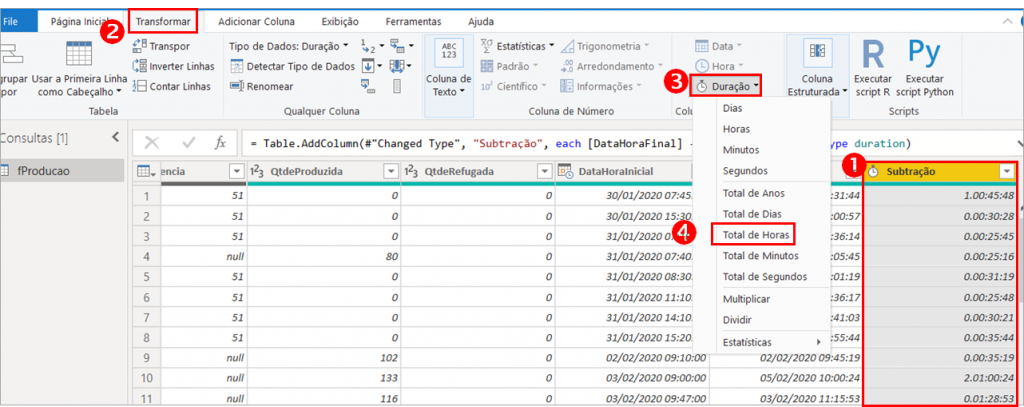
Steps:
1. Click on the Subtração column
2. Go to Transformar (Transform)
3. Click on Duração (Duration)
4. Select Total de Horas (Total Hours)
Let’s rename this Subtração column to Horas. You can edit the previous steps or add a new step. I always suggest reducing the number of steps applied by editing the previous steps to improve performance and make data loading (and refreshing) faster.
Now that we have the column with the elapsed time (Horas), we can divide the columns DataHoraInicial and DataHoraFinal into two columns each (one with date and one with time), right ?! We will do this using PQ’s Split Column feature.
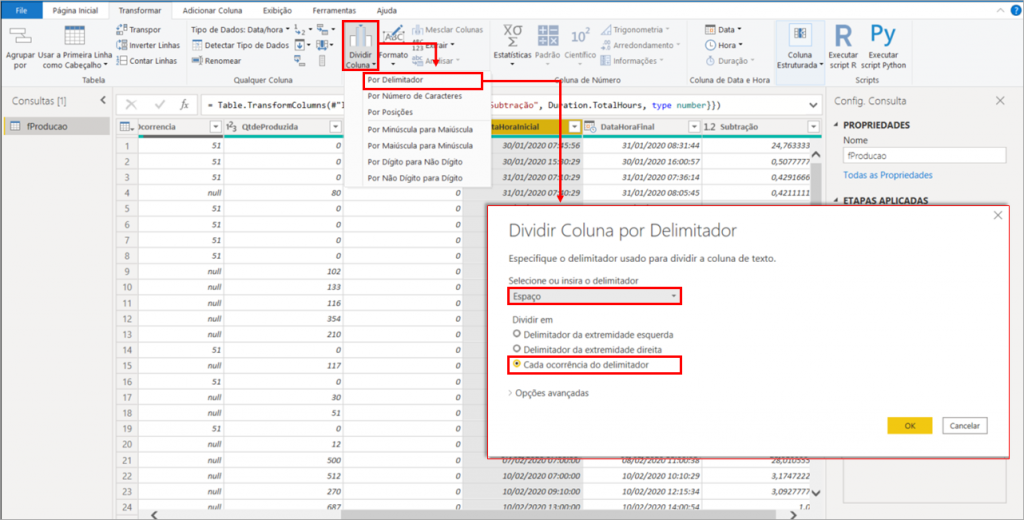
Steps:
1. Click on the column DataHoraInicial
2. Go to Transform
3. Click on Split Column
4. Select By Delimiter
5. Select Space and Each occurance of the Delimiter
You will note that PBI, when dividing this column in two, automatically renamed it to DataHoraInicial.1 and DataHoraFinal.2.
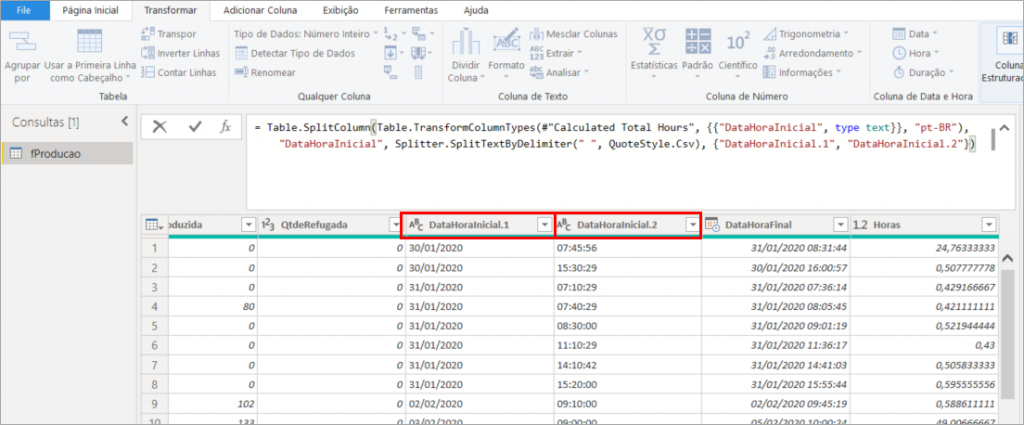
Those names are ugly, right ?! Let’s edit previous steps and rename them:
See above that we renamed DataHoraInicial.1 to DataInicial and DataHoraInicial.2 to HoraInicial.
You must repeat exactly the same procedure with the column DataHoraFinal, ok ?!
Finally, click Close and Apply.
Measures in hh:mm:ss format
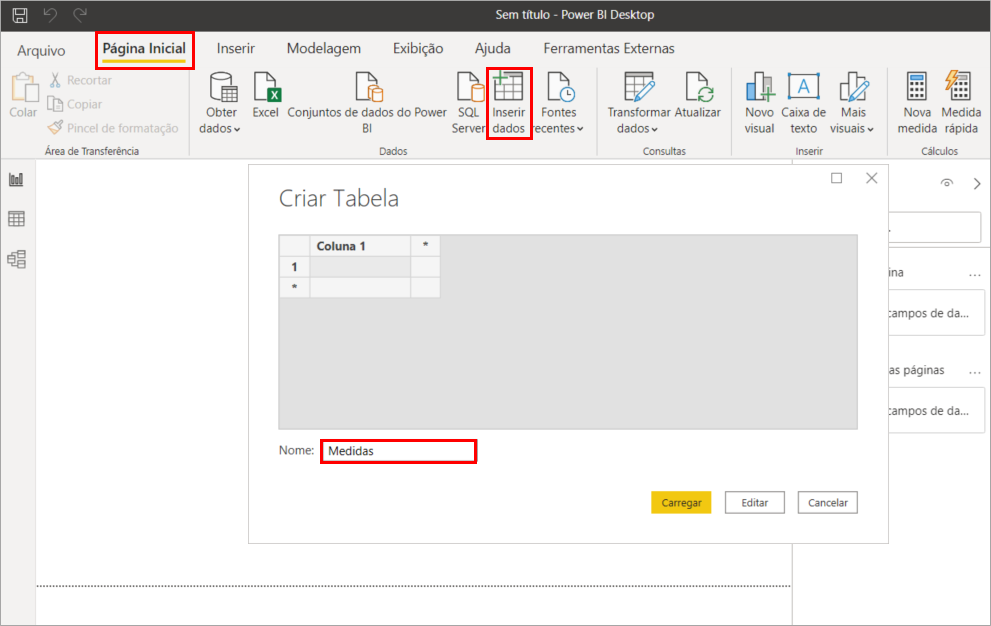
We will create our first measure! Before that, let’s insert a ‘blank’ table just to organize our measures in the Fields panel.
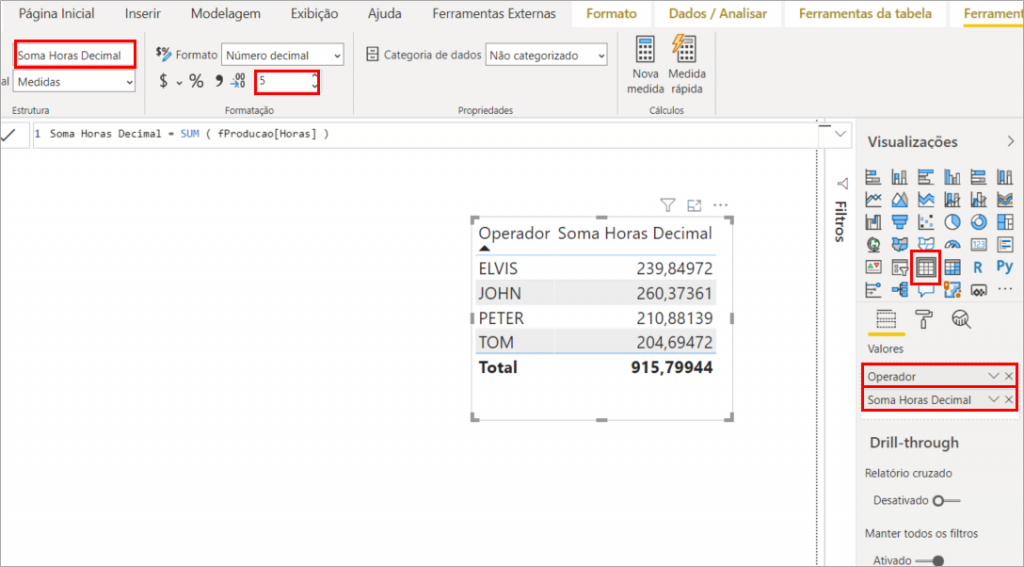
Our first measure will be the sum of Hours (“Soma Horas Decimal” in the formula below).
Note that when we add a Table type visual with the Operador column and the Soma Horas Decimal measure, we have the following:
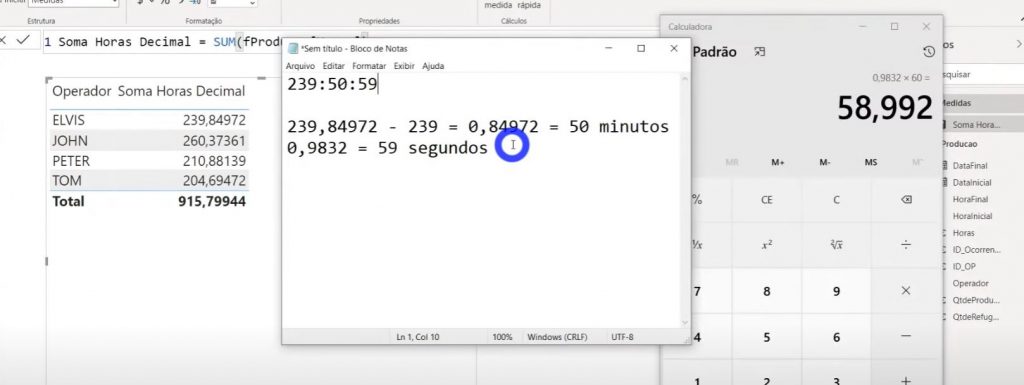
Now we need to do some calculations to find out how many whole hours, minutes and seconds this measure has. To convert this decimal value from hours to minutes, just multiply the entire decimal part (after the comma) by 60. To convert minutes to seconds, we need to take the decimal part of the previous result and multiply it by 60 again, right? See the calculations we made on the calculator for the value of the first line of the Table (operator ELVIS):
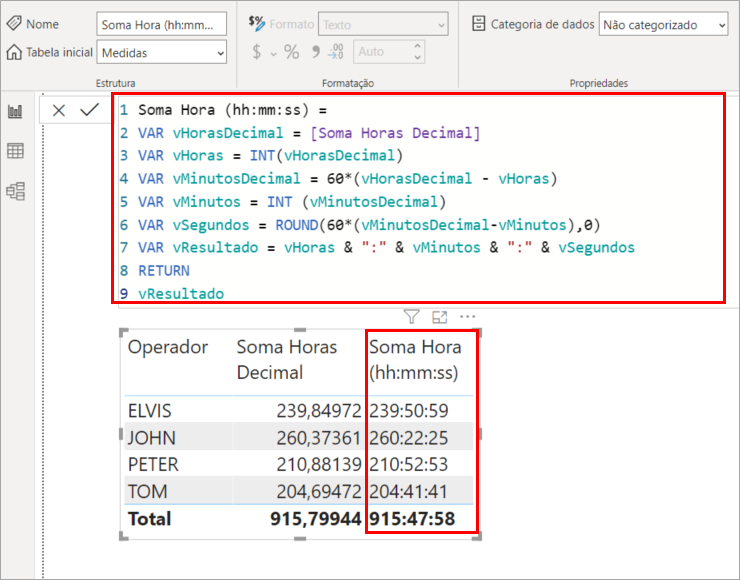
We will create a DAX measure to replicate this calculation. See that we won’t need to create multiple measures because we will use variables! Here is the complete command to make your life easier:
Soma Hora (hh:mm:ss) =VAR vHorasDecimal = [Soma Horas Decimal]
VAR vHoras = INT ( vHorasDecimal )
VAR vMinutosDecimal = 60 * ( vHorasDecimal – vHoras )
VAR vMinutos = INT ( vMinutosDecimal )
VAR vSegundos = ROUND ( 60 * ( vMinutosDecimal – vMinutos ), 0 )
VAR vResultado = vHoras & “:” & vMinutos & “:” & vSegundos
RETURN
vResultado
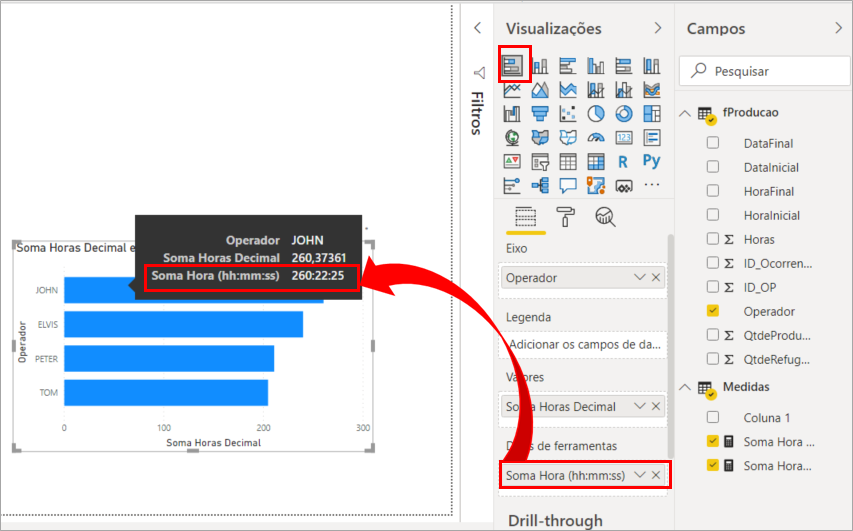
See that we managed to present the hh: mm: ss format via DAX:
Note that if we try to insert this measure on the axis of some standard Power BI chart, we won’t be able to. But you can use this measure as a tooltip:
As our total hours are in decimal, it will be easy to calculate the average (“Media” in the image below), see:
Media Horas Decimal = AVERAGE ( fProducao[Horas] )
To calculate the average in the hh: mm: ss format, you just need to copy the code for the Soma Horas (hh: mm: ss) measure and change the variable vHorasDecimal to use the Media Horas Decimal measure instead of Sum of Soma Horas Decimal.
Let’s see how these two new measures look in the table?
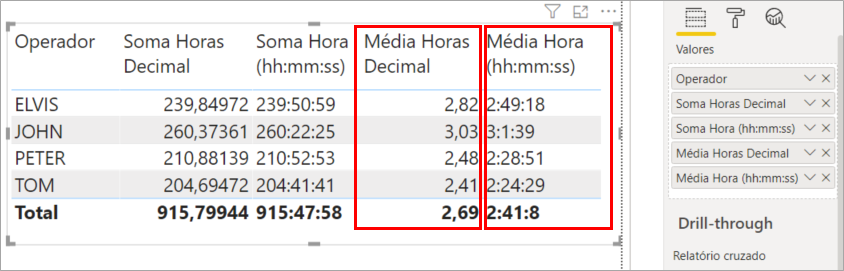
You know I have O.C.D., right ?! I need to fix this last measure we created to set the hours, minutes and seconds with in double digits.
VAR vHorasDecimal = [Media Horas Decimal]
VAR vHoras = INT ( vHorasDecimal )
VAR vMinutosDecimal = 60 * ( vHorasDecimal – vHoras )
VAR vMinutos INT ( vMinutosDecimal )
VAR vSegundos = ROUND ( 60 * ( vMinutosDecimal – vMinutos ), 0 )
VAR vHH = IF ( LEN ( vHoras ) = 1, “0” & vHoras, vHoras )
VAR vMM = IF ( LEN ( vMinutos ) = 1, “0” & vMinutos, vMinutos )
VAR vSS = IF ( LEN ( vSegundos ) = 1, “0” & vSegundos, vSegundos )
VAR vResultado = vHH & “:” & vMM & “:” & vSS
RETURN
vResultado
Let’s also build and fix the Soma Hora measure (hh: mm: ss):
VAR vHorasDecimal = [Soma Horas Decimal]
VAR vHoras = INT ( vHorasDecimal )
VAR vMinutosDecimal = 60 * ( vHorasDecimal – vHoras )
VAR vMinutos INT ( vMinutosDecimal )
VAR vSegundos = ROUND ( 60 * ( vMinutosDecimal – vMinutos ), 0 )
VAR vHH = IF ( LEN ( vHoras ) = 1, “0” & vHoras, vHoras )
VAR vMM = IF ( LEN ( vMinutos ) = 1, “0” & vMinutos, vMinutos )
VAR vSS = IF ( LEN ( vSegundos ) = 1, “0” & vSegundos, vSegundos )
VAR vResultado = vHH & “:” & vMM & “:” & vSS
RETURN
vResultado
Drill down in seconds
The next task will be to create a dCalendar and we will be able to reach the seconds level in the drill down!
Keep in mind that the dCalendario table should ALWAYS be in DATE granularity, never hour!
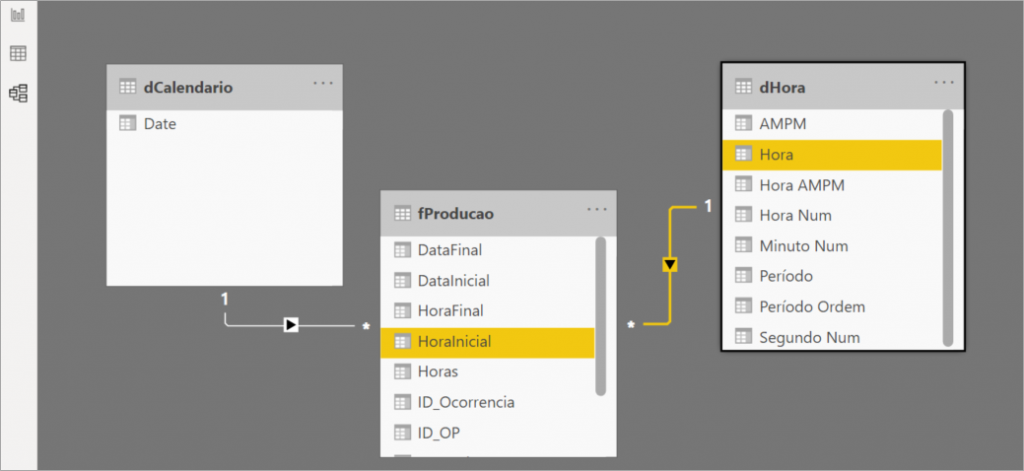
This task seems complex but it is not! To relate the hours of the fact table you will need to create a dimension table of time (dHora).

The first thing to do is to build our dCalendario. We will do it via DAX, see:
dCalendario = CALENDAR ( DATE ( 2020, 01, 01 ), DATE ( 2020, 12, 31 ) )With the dCalendario created, we will need to relate it to our fact table. The choice of the DataInicial or DataFinal column will depend on your model – which you will consider most important. I chose DataInicial of the fProducao table to relate it to the Date column (of the dCalendario table), see:
We will need to go back to Power Query to create the dHora table. First create a Blank Query and then go to the Advanced Editor to paste the code available below:
M Code to be copied and Paste in the Advanced Editor
Lista = {0..86399},
ConverteParaTabela = Table.FromList(
Lista,
Splitter.SplitByNothing(),
null,
null,
ExtraValues.Error
),
AlteraTipo = Table.TransformColumnTypes(ConverteParaTabela, {{“Column1”, Int64.Type}}),
AlteraNomeCol = Table.RenameColumns(AlteraTipo, {{“Column1”, “Segundo”}}),
ColDuracao = Table.AddColumn(
AlteraNomeCol,
“Duração”,
each #duration(0, 0, 0, [Segundo]),
type duration
),
ColHora = Table.AddColumn(
ColDuracao,
“Hora”,
each #time(
Duration.Hours([Duração]),
Duration.Minutes([Duração]),
Duration.Seconds([Duração])
),
type time
),
RemoveCols = Table.RemoveColumns(ColHora, {“Duração”, “Segundo”}),
ColHoraNum = Table.AddColumn(RemoveCols, “Hora Num”, each Time.Hour([Hora]), Int64.Type),
ColMinutoNum = Table.AddColumn(ColHoraNum, “Minuto Num”, each Time.Minute([Hora]), Int64.Type),
ColSegundoNum = Table.AddColumn(ColMinutoNum, “Segundo Num”, each Time.Second([Hora]), Int64.Type),
ColAMPM = Table.AddColumn(
ColSegundoNum,
“AMPM”,
each if [Hora Num] < 12 then “AM” else “PM”,
type text
),
ColHoraAMPM = Table.AddColumn(
ColAMPM,
“Hora AMPM”,
each
if [Hora Num] = 0 then
“12 AM”
else if [Hora Num] >= 1 and [Hora Num] <= 11 then
Number.ToText([Hora Num]) & ” AM”
else if [Hora Num] = 12 then
“12 PM”
else if [Hora Num] >= 13 then
Number.ToText([Hora Num] – 12) & ” PM”
else
“Unknown”,
type text
),
ColPeriodo = Table.AddColumn(
ColHoraAMPM,
“Período”,
each
if [Hora Num] >= 0 and [Hora Num] <= 5 then
“12AM to 6AM”
else if [Hora Num] >= 6 and [Hora Num] <= 11 then
“6AM to 12PM”
else if [Hora Num] >= 12 and [Hora Num] <= 17 then
“12PM to 6PM”
else if [Hora Num] >= 18 and [Hora Num] <= 23 then
“6PM to 12AM”
else
“Unknown”,
type text
),
ColPeriodoOrdem = Table.AddColumn(
ColPeriodo,
“Período Ordem”,
each
if [Hora Num] >= 0 and [Hora Num] <= 5 then
1
else if [Hora Num] >= 6 and [Hora Num] <= 11 then
2
else if [Hora Num] >= 12 and [Hora Num] <= 17 then
3
else if [Hora Num] >= 18 and [Hora Num] <= 23 then
4
else
5,
Int64.Type
)
in
ColPeriodoOrdem
The original reference of this code can be found by clicking here.
After renaming Consulta1 (Query1) to dHora, our table will look like this:
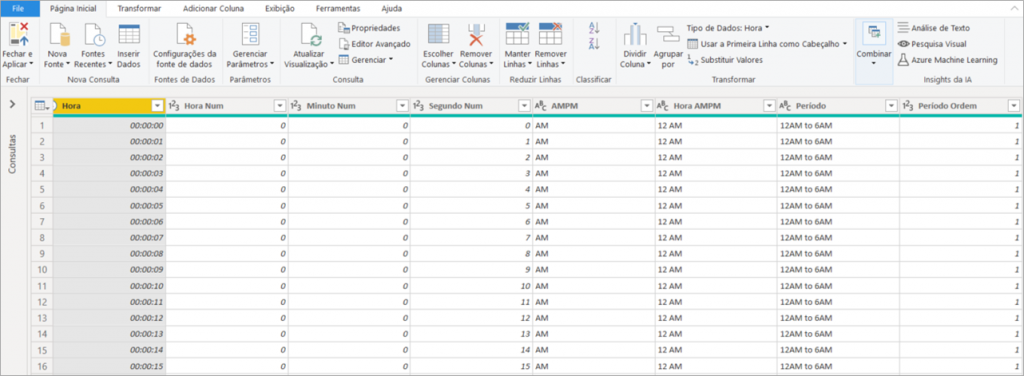
Notice that we will have 1 new row for every second of the Hour column. That is, if we multiply 60 (sec) x 60 (min) x 24 (h) we will have a total of 86400 lines, ok ?!
Click Close and Apply and relate the dHora table to the fProducao table:
Let’s see how Drill down will look on the area chart? See how we did it to reach the AMPM level:
Continuing to the detail in seconds:
Bonus Tip
During Live # 27 I mentioned that there was NO way to add the hh: mm: ss format to a visual other than via a tooltip. But our colleague Alfonso Haskel saved us!

Oh, I suggest this vídeo that shows you how to use other custom number formats in Power BI – like the parentheses for negative numbers that finance and accounting people use
Well, to the solution! The first thing we will do is concatenate the hours, minutes and seconds and then convert the result to Integer using the CONVERT function directly in that Soma Hora (hh: mm: ss):
Soma Hora (hh:mm:ss) =VAR vHorasDecimal = [Soma Horas Decimal]
VAR vHoras = INT ( vHorasDecimal )
VAR vMinutosDecimal = 60 * ( vHorasDecimal – vHoras )
VAR vMinutos = INT ( vMinutosDecimal )
VAR vSegundos = ROUND ( 60 * ( vMinutosDecimal – vMinutos ), 0 )
VAR vHH = IF ( LEN ( vHoras ) = 1, “0” & vHoras, vHoras )
VAR vMM = IF ( LEN ( vMinutos ) = 1, “0” & vMinutos, vMinutos )
VAR vSS = IF ( LEN ( vSegundos ) = 1, “0” & vSegundos, vSegundos )
RETURN
CONVERT ( vHH & vMM & vSS, INTEGER )
Now, just change the format of this measure by typing in Format “00:00:00”, see:
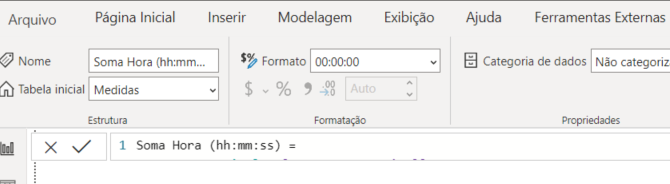
Ready to see how that measure will look on a visual?
To display the format correctly, just go to Display units (under Labels – Views panel) and select None, ok? You must do the same on the Y Axis:
Well, that’s it!
Hope you liked the content.
Regards,
Leonardo.