In today’s content, we are going to talk about how to connect to and integrate databases from different systems. If you deal with daily business intelligence, data analysis and report creation then you know how important this subject is! I will share with you in a very complete and detailed way:
- What a data warehouse is and how to view a database
- How to get data from different sources in Power BI
- How to integrate bases
- What data flow is and how it works
Data Warehouse and Database Visualization
First, let’s take a look at the traditional Power BI process in the image below. It is very interesting to have this image of the process in mind, to facilitate the understanding of the BI process flow.
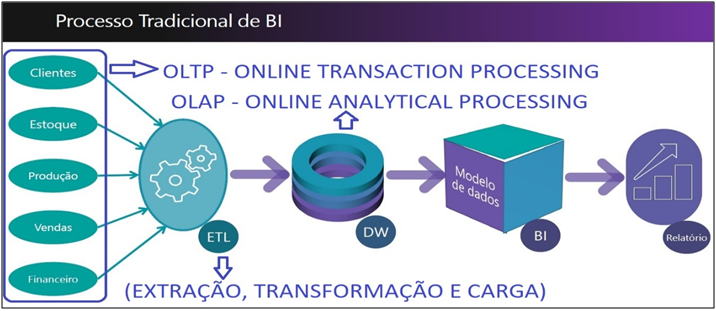
Image 1: BI Process Flow
We can see that every process starts in the database (OLTP – Online Transaction Processing). From that information, we perform the ETL (extraction, transformation, and loading) process and send it to the Data Warehouse (OLAP – Online Analytical Processing). The data may be from several different sources (Excel, SQL, ERP, Web folders). The idea of the Data Warehouse (DW) is to store a large volume of data, making it better conditioned and enabling the analysis of those that are collected from transactional systems (OLTP). So, why doesn’t everyone have a Data Warehouse? There are some aspects that lead to not having a DW: lack of people, investment fund, or time. This is where Power BI comes in, as it allows the user to integrate several data sources and then connect the information.
In today’s example, we are going to use information from the database of the company Adventure Works (fictitious) to simulate a scenario where this connection is needed. Where can this data be viewed? In a command manager! (for example, SQL Server). Let’s use SQL for a very basic visualization demonstration in this type of software.
| Important: There are 2 important aspects when managing the database! · Have access to the database (this is normally aligned with the IT staff, as access may be required by the information administrator) · Have access to the manager |
| Tip: If you don’t have SQL, you can download the free developer version at https://www.microsoft.com/en-us/sql-server/sql-server-downloads. Choose the Developer option (free for test purpose). For installation and software details, visit this link https://docs.microsoft.com/en-us/sql/database-engine/install-windows/install-sql-server?view=sql-server-ver15 or any of the various videos on YouTube demonstrating the installation step by step. |
For our case, we will use a local database without the need for authentication. Below you can see the information from the databases we will use inside the server. To understand it in a simple way, try to imagine that there are several Excel files with tables inside and that each Excel file would be a database.
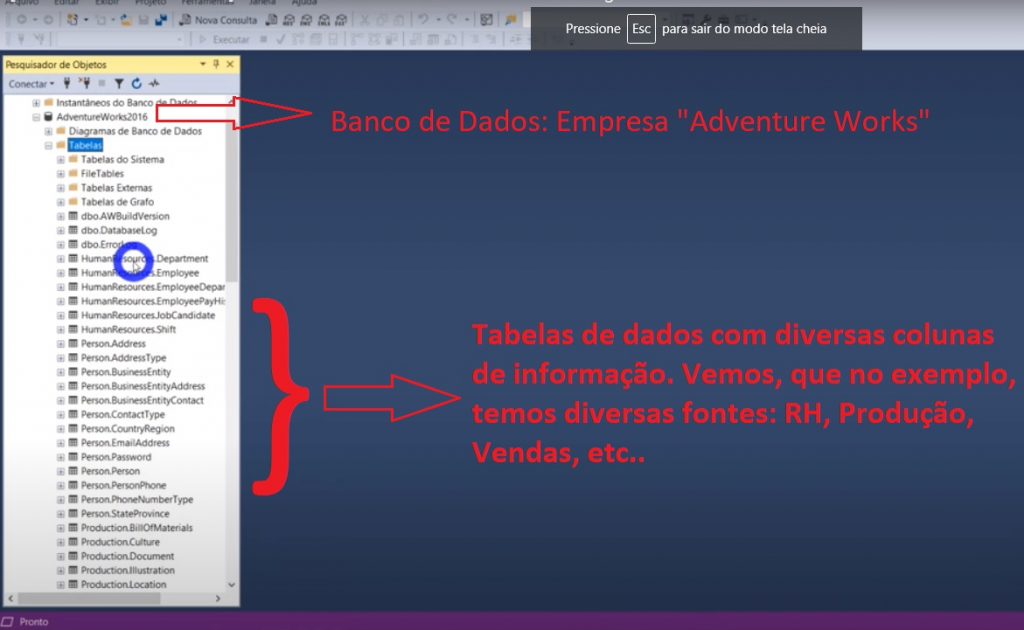
Image 2: Visualization of Database in SQL Server
The visualization we are going perform is very simple and based on the database used in the advanced DAX course. For example, how do I see all the information I have in the customer table? To do this, just click:
Command: New Query> SELECT * FROM Cliente
We can also view only the desired columns, and for that it must be explained after “SELECT” as follows:
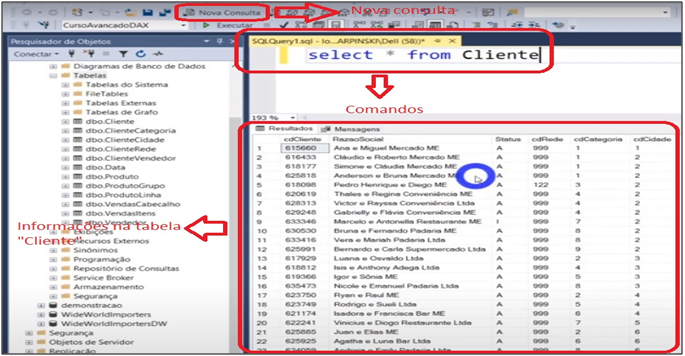
Image 3: Visualization of Complete Table in SQL Server
Command: New Query> SELECT cdCliente, RazaoSocial FROM Cliente
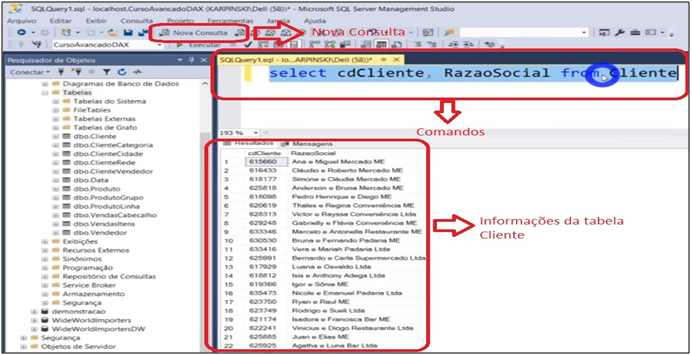
Image 4: Visualization of Selected Columns in SQL Server
Another way to view is:
Command: Right-click on the table> Select 1000 top lines
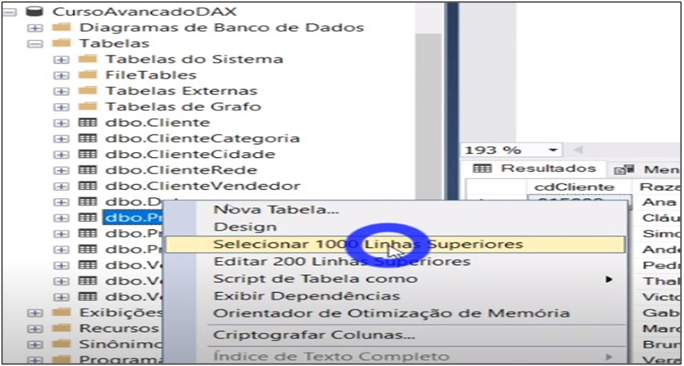
Image 5: Command for Table visualization in SQL Server
Get Data – Power BI
In a simple way we can import this information into Power BI in “Get data”, where we can see a wide variety of databases that can be imported. The list is long and you can check it on this MS link https://docs.microsoft.com/en-us/power-bi/connect-data/desktop-data-sources. If you can’t find a specific type for your database, you still have the ODBC option. You can find a more detailed explanation of ODBC at this MS link https://docs.microsoft.com/en-us/sql/odbc/reference/what-is-odbc?view=sql-server-ver15.
Back to our case, we are going to import the database we just talked about in SQL for Power BI. To do so, we have two options: import or use DirectQuery. What then? Which to use ?? From experience, importing solves almost every case, unless you have a real need to refresh information online. When in contact with who will use the information (managers, senior leadership or internal customers) you will probably be asked for the Online information. In this case, questioning is important to identify the real need. Remember, real-time analytics and BI are different concepts. Anyway, let’s get the data in:
Command: Get data> SQL Server database
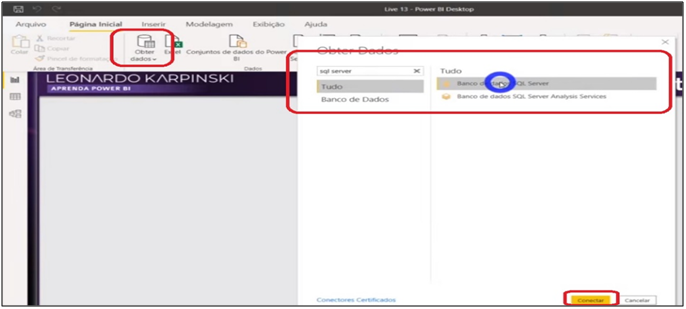
Image 6: Getting data from SQL Server
We also see the option of using Query in this part. For those who from business area, you may have had contact with the IT team in this part where we insert the commands before executing the import.
| Important: In that case, the database is local! If you were to connect to a server source, you would enter another stage where information would be needed for the connection. |
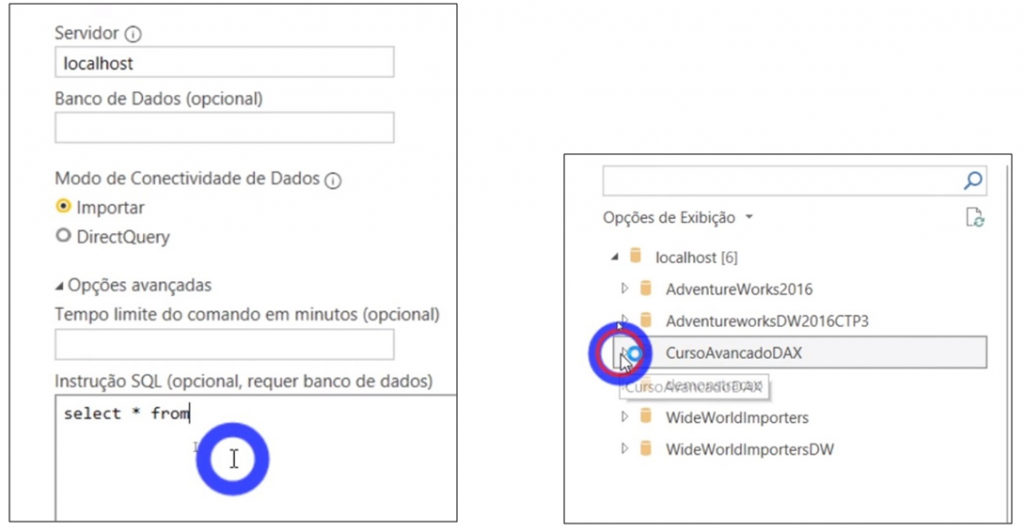
Image 7: Server visualization e Database selection
After choosing the database we will work on (CursoAvancadoDAX), we must choose the information tables we are going to import. Finally, we have the option to load or transform the data. So, what to do? Always remember the ETL sequence (Extraction, Transformation and finally Load) to avoid skipping steps. So, we have to transform the file.
Data Transformation
What is the first step you take in the transformation process? The first step should always be to remove the unnecessary from the tables! Which means, choose the columns that will be needed. Ah Leonardo, I will need everything! Really? I doubt that you really need all the columns in all every table. At least, it’s usually not like that! You should remove, mainly, the information that does not add in the analysis. Needing everything is usually a myth. Always remember the performance and optimization aspects in your analysis.
| Tip: An action that helps a lot to perform this process correctly is to mark the necessary columns! This is different from deselecting the columns you don’t need, as it forces you to choose one by one whichcolumns will ne used for analysis. |
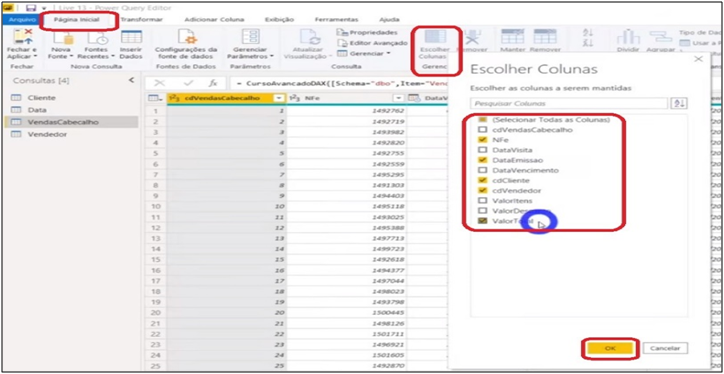
Image 8: Columns Selection for the Model
Command:
VendasCabecalho> Home> Choose Columns> Selection (“NFe, DataEmissao, cdCliente, cdVendedor, ValorTotal”)
Cliente> Home> Choose Columns> Selection (“cdCliente, RazaoSocial, Status”)
In this case, the “formatting” of the data was performed automatically and correctly. So, with that we can close and apply! Thus, we will be loading the data into the machine’s memory. In fact, this is one of the reasons why BI is fast.
Initial Analysis
With everything ready, let’s start the analysis? First, let’s create the Revenue measure, a card and chart for visualization.
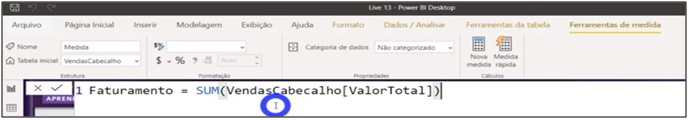
Image 9: Revenue measure
Command: Revenue = SUM (VendasCabecalho [ValorTotal])
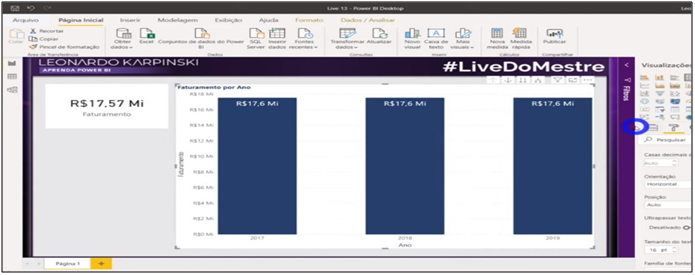
Image 10: Card and Chart (Date e Revenue)
Formatting:
Card:  Fields > Revenue
Stacked Column Chart:  Axis > Date
Values > Revenue
Data Label > On
Let’s analyze the image. What do you think about the data? Revenue values are the same for all years, right? Why did this happen? If you answered that the dates we put on the graph axis are not related to the revenue dates, you are right! Let’s go to the model and make the relationships between the tables and view the information after the relationship.
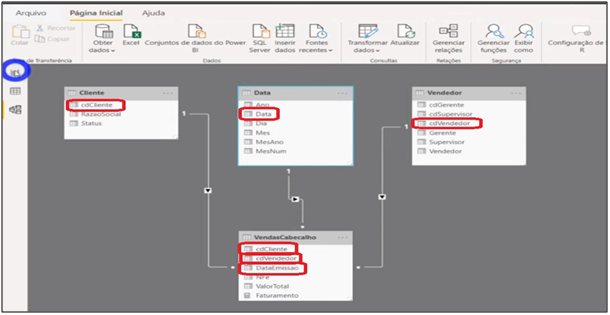
Image 11: Model Relationships

Image 12: Chart after Model Relationship
| Tip: After loading the data, it is important to go to the model and check the tables relationships. Remember to check if the relationships are star-like and check for relationships: “both” and “many to many”. In such cases, you must be precautious and assess whether it makes sense to maintain it that way. It is important that you find a way to organize the tables for easy visualization. |
Database Integration
Now, Imagine that we have to link the revenue from this database (local sales) with the revenue from another database (online sales). However, online sales information is not in the SQL database we used. In addition, we don’t have in this online sales table the customer code information (“Cod Client”) with the exact values or the seller code (“User”) to make the relationship. Have you been through a situation like this? What to do?
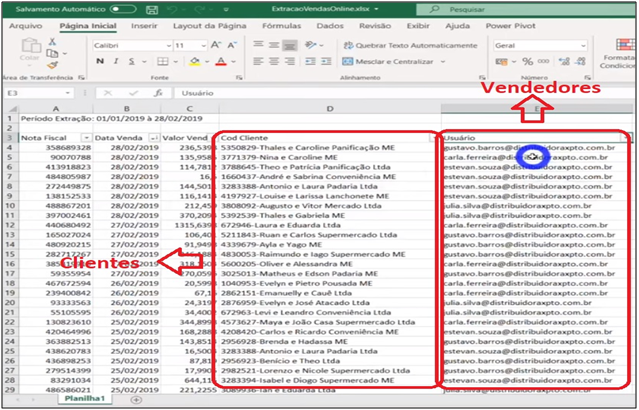
Image 13: Online Sales Table
We are going to import the file via One Drive, which means, a web path for that table. To do so we have to “upload” the file to the network. With the file storaged in the cloud, we will open it in Excel app on the machine (this means that we will run the file that is in the cloud on the local PC).
| Tip: If you don’t know how to upload files to the cloud, access this link with the explanation on the Microsoft website: https://support.microsoft.com/en-us/office/upload-photos-and-files-to-onedrive-b00ad3fe-6643-4b16-9212-de00ef02b586?ui=en-us&rs=en-us&ad=us |
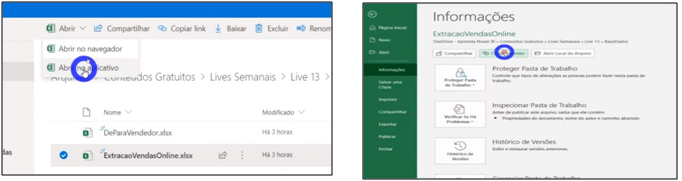
Image 14: Copying the One Drive file path
Let’s import this table into Power BI. What source to use in “Get data”? Excel or Web? File or path? We will use the cloud path (remember to remove the term “? Web = 1″ from the end of the copied link) when importing and I will explain the reason at the end of this article.
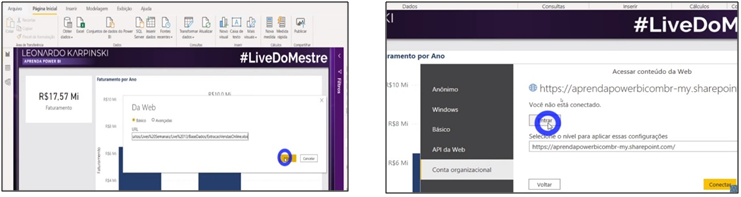
Image 15: Getting data from OneDrive
After importing the tables, we will transform the data. Let’s remove the initial step of promoting header and changing data type. After excluding these two steps, we go to column 2 and remove nulls. So, let’s promote the headers and change the data types.
We can see that in the customer column, the information doesn’t have the same pattern as our customer code. What to do? By analyzing the columns we see that we have to extract the code (the numbers) from the Cod Client column of the online revenue table. For this, we will transform the column by extracting these numbers and make the relationship.
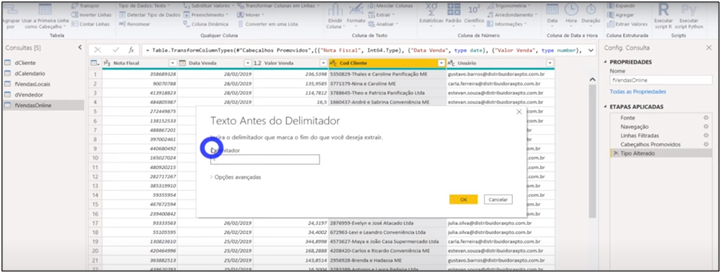
Image 16: Client Code Extraction
Now, let’s analyze the user information. We have the email, but we don’t have the code. Think like this, if IT did not allow importing the email into our database, what to do? We can use “From -> To”. And for that we use a support table. We won’t be able to merge the information without doing so, as we don’t have the email information or the code in the two tables to make this relationship. Remember, it will often be necessary to have a support table (“From -> To”) that provides information FROM one source TO another source. Another option is to use a column of examples. However, we have to be careful, because if you change the table pattern, the whole process is lost.
Alright, it’s very simple. First, let’s upload our support table to One Drive as we did for the online sales table (if you don’t know how, use the tip in this article … you will soon be good at this) and import along the way as we did with the table online sales.
Usually, the “From -> To” table is disabled in the model. We use the information from this database by merging it with another query which is the table of interest. It’s preferabçe to do the relationship using “Merge” in Power Query than loading the information into the model (it is very similar to Excel’s “VLOOKUP” and SQL’s “JOIN”).
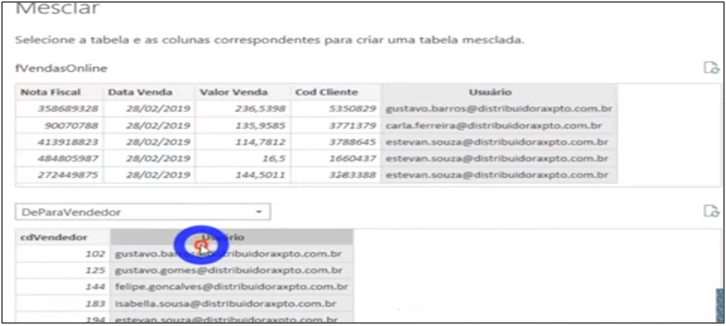
Image 17: Merging the Online Sales Table and From -> To
A Privacy Level window will appear, because there is an exchange of information between sources and it is necessary to assess confidentiality. It is important to evaluate this issue in the corporate environment routine. In our case we will just ignore!
The “From -> To” table is complete, but we only want the seller code information for online sales. Then, we remove the column “Usuário” (as it is not necessary), change data and disable the “From -> To” load. Remember that the seller code and the customer code must be the same in the fact and dimension tables in order to enable the relationship. Also remember that it’s still being refreshed, but it won’t be loaded into the model.
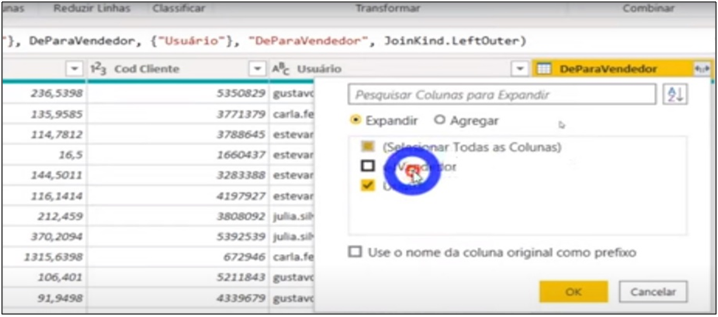
Image 18: Columns selection for expanding
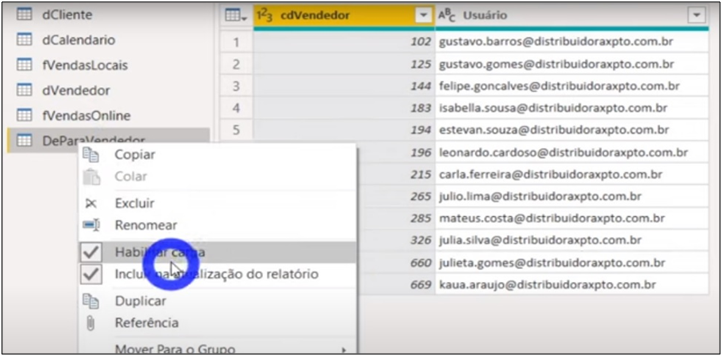
Image 19: Disabling the From -> To table load
| Important: Organization in development is very important so it is good if you identify the fact and dimension tables in Power Query. We usually identify the fact tables with the prefix “f” and the dimension tables with “d”, as you can see in the image above. |
With all the information, we close and apply Power Query and go to the model to make all the relationships of the tables.
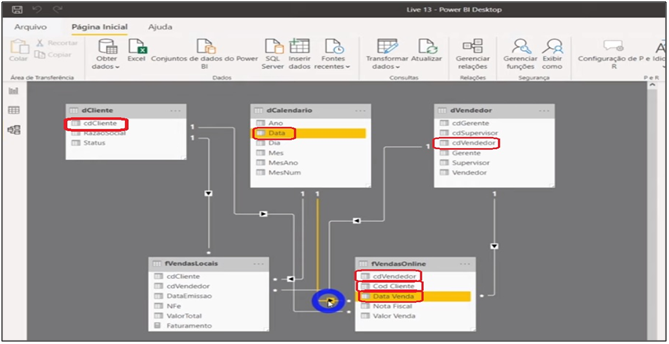
Image 20: Online Sales Table relationship in the Model
Well, we have all the relationships and sales information now. Does this mean that the analysis is ready? No, we have to add the online sales. It contributes to the total revenue measure. For this, we will create two additional measures and change the measure that we have already created. Thus, we will have 3 measures: total sales, local sales and online sales. Finally, let’s create another stacked column chart to compare total revenue with the other two.
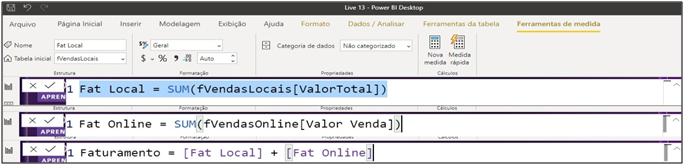
Image 21: Measures – Local, online and total revenue
Measures:
Local Rev = SUM (fVendasLocais [ValorTotal])
Online Rev = SUM (fVendasOnline [Valor Venda])
Revenue = [Local Rev] + [Online Rev]
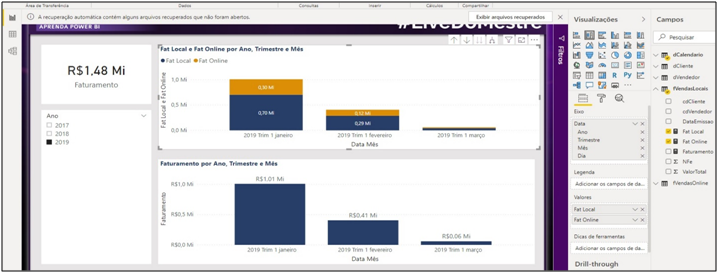
Image 22: Charts with created measures
Formatting:
Stacked Column Chart: Axis> Date
Values> Local Rev and Online Rev
Data Labels> On
Well, analysis done! Finished? What if we update the files, both in the database and in the cloud? What happens? The file continues to be refreshed. A major attention point is to maintain the standardization of names and information within the file. Another point is to remember that the information has to be refreshed in the cloud and we must, after this refresh, also update the pbix file.
Data Flow
In this article, I mentioned that we imported the data from the sales table and the From -> To table for a reason. Have you thought what it could be? We did this, because when we use this information in the Data Flow (data flow) in the online service, we avoid the gateway!
And why use the data flow? Imagine that you need it in more than one of your online sales table projects (ready to go, with all the transformations done). So, can you imagine having to do all the work again? Waste of time, right? Here comes one of the advantages of data flow. In 2019 Microsoft launched this feature that works like an online Power Query and is a place where we can centralize information. Much like a Data Lake or a Data Warehouse!
Let’s go to the Power BI online service to see it better! To use the data flow you must be in a pro workspace environment. We have to go to “New” and “Data Flow” in one of these workspaces in order to create.
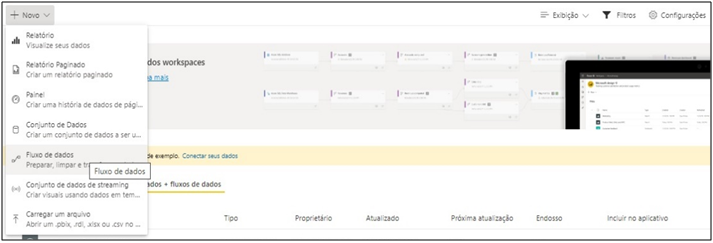
Image 23: Creating Data Flow in Power BI Service
In the next window, click on add new entity.
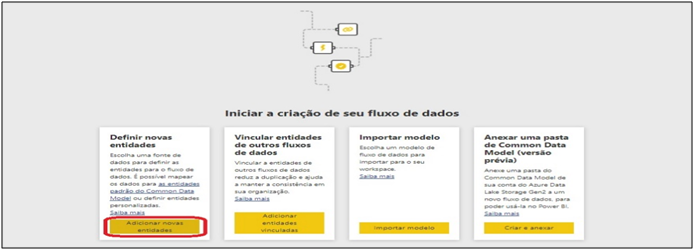
Image 24: Adding New Entities
The next window is very similar to the “Get data” environment of Power BI and has the same options.
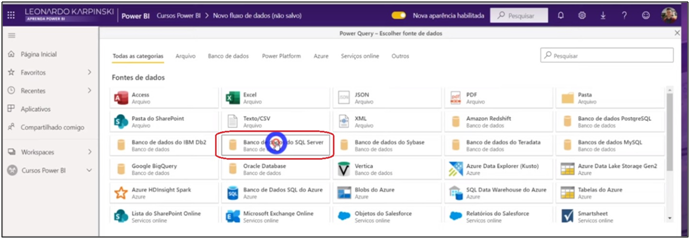
Image 25: Getting Data from SQL Server in Power BI Service
In this case, the SQL database that we are going to import is on my machine (localhost), so I need a gateway to upload the information.
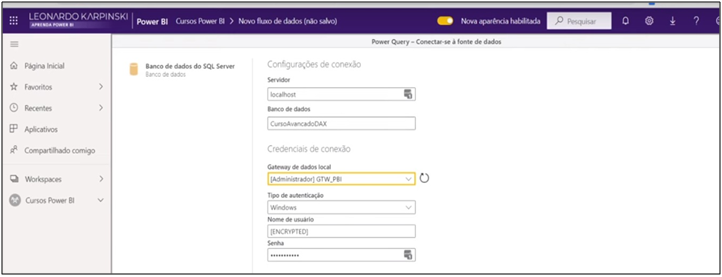
Image 26: Setting up the Connection
We go to import, choose the tables we want to work on and transform data. See that they are similar screens and process as in the the Power Query environment in Power BI Desktop. What happens is that in this case the information is saved in CSV files on Azure as an additional layer in the model’s process. This layer does not hinder the performance of the model and works very well!
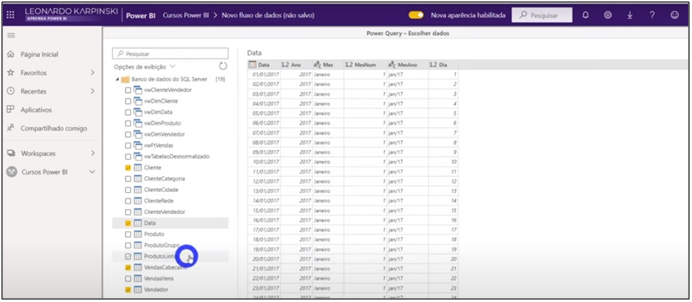
Image 27: Chossing the tables for import
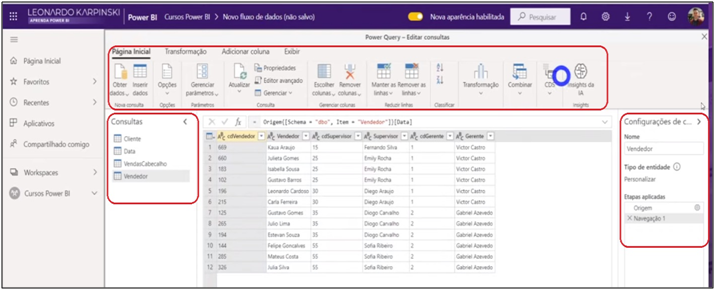
Image 28: Visualization of Power Query in the Data Flow Service
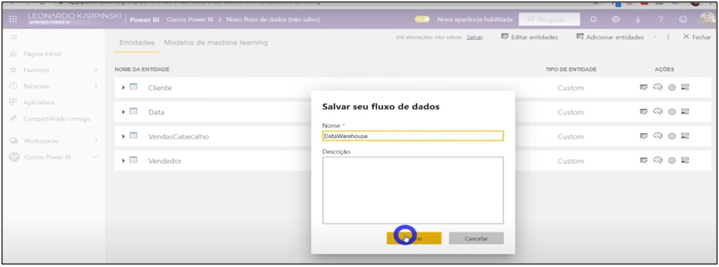
Image 29: Saving Data Flows
Attention after finishing the creation of the data flow, because an option to schedule the data flow refresh will be displayed i! I will explain this step at the end of the article in more detail.
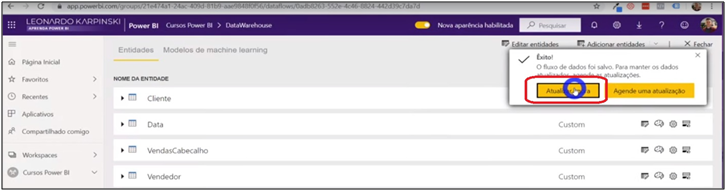
Image 30: Data Flow refresh Selection
Let’s open a new file in BI and get data from these flows we’ve just created. You will need to connect to the organizational account. After connecting with your account, it shows the flows created for the online service workspaces. We will import the same information from our sales model. See that we can re-model this information from the Power BI data flow … as I mentioned earlier, it is like another “layer” in the process.
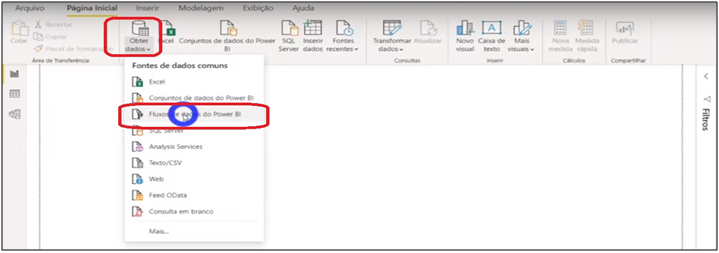
Image 31: Getting Data from Data Flows
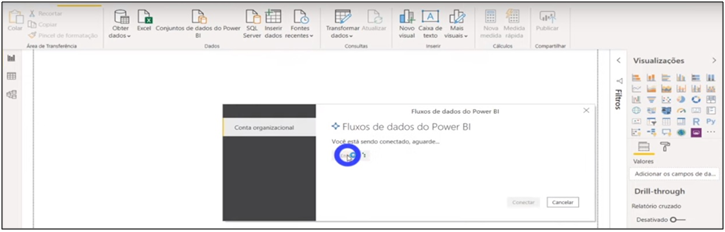
Image 32: Connecting to Organizational Account
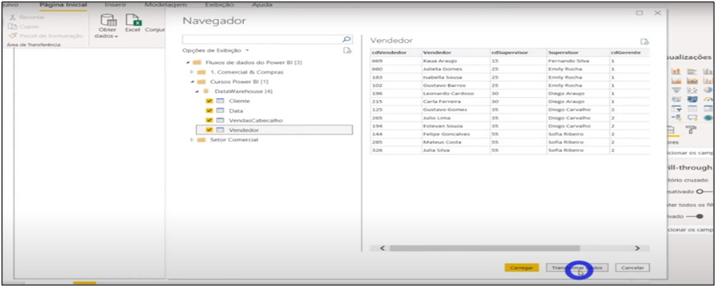
Image 33: Selecting Tables for Data Transformation in Power Query
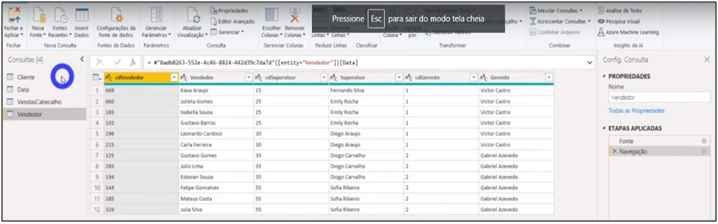
Image 34: Tables visualization for Transformation in Power Query
Well, what about the refresh of online service using data flows? There are sequential steps to perform the refresh:
1. Schedule the data flow refresh on the online service;
2. Schedule the refresh of the data set in the online service remembering that the scheduled time must be later than the refresh of the data flow and must take into account the time it takes to refresh the data flow so that there is no overlap (also can be scheduled 8 times a day);
3. The model is refreshed automatically with the data set schedule.
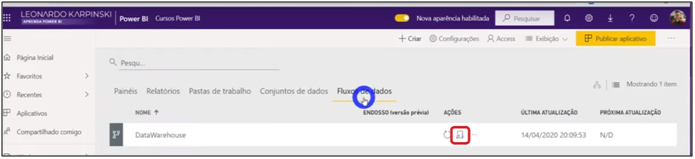
Image 35: Selecting Data Flow Refresh in Power BI Service
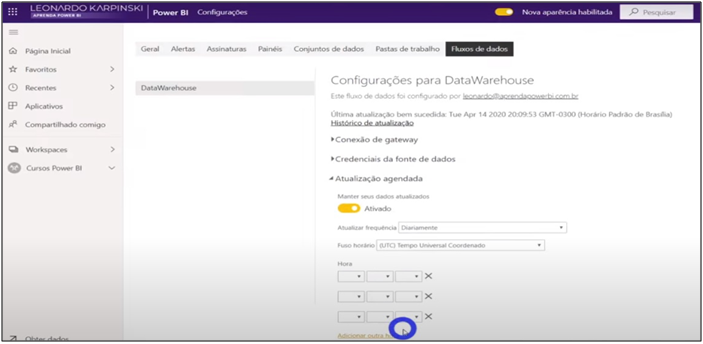
Image 36: Setting the Data Flow refresh
Back to the question: why do we use One Drive for our Excel files containing the online sales table and the From -> To table? Because when using an Online file we don’t need to configure a gateway! This helps a lot in the update !!
We are going to publish this new model we just created in Power BI Desktop. I inserted a card so it wouldn’t go completely blank.
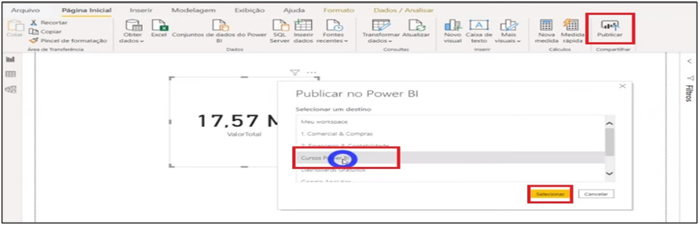
Image 37: Publishing the model
The process so far has been:
- Create the data flow in the Power BI Data Warehouse;
- Connect the data to the model;
- Publish to the Online report.
Now we have the advantage of the gateway! We don’t need the gateway to refresh the data set, as it comes from the data flow, which means, it already has an online service connectivity. In addition, the online sales files and From -> To table are in One Drive, so you also do not need the gateway. So, we updated the data set.
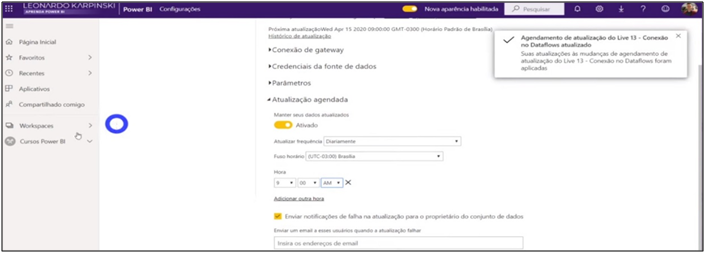
Image 38: Dataset refresh
| Tip: I will address the data flow topic in more detail in one of the next Youtube Lives, stay tuned! The link https://docs.microsoft.com/en-u/power-bi/transform-model/service-dataflows-create-use from Microsoft has also detailed the process of creating and using this tool. |
I believe that by following all the steps and tips in this article you will understand about what Data Warehouse is and how to view a database. I also believe that you have the knowledge to get data from different bases in Power BI and if necessary how to integrate them. Finally, I hope you have understood how the Power BI data flow works.
If you have any questions or wish to suggest another subject for future articles, get in touch!
Hope I could help!
Leonardo.