What’s up guys! How you all doing?
Today the content is dedicated to those who are really starting or want to start learning about Power BI and got any kinds of fears, a topic I talked about at Live #12. Do you think you won’t make it? Can it be too difficult? Not sure if it will be worth it? Forget those doubts, follow this post until the end and your problems are over!
I will show that it is worthwhile (very much) learning Power BI to open doors in business market. In addition, the learning curve for working with the software is very fast.
Initial doubts
A question people always ask me: “Leo, I am not a Excel expert… will I be able to learn Power BI?” Guys, it’s a myth that you need to know Excel to be able to learn Power BI! I personally do not have full control over Excel… but talking about Power BI, I do. To be honest, they are different tools. You don’t need to know Excel (little or much, forget it!) to learn Power BI. Think like that, Excel knowledge is not a prerequisite.
It may be that in some formulas or logic it becomes easier to assimilate if you already know Excel. However, I have seen cases of people who are experts in Excel who have difficulty learning Power BI, because in Excel we have the possibility to work with cells and in Power BI we work with columns..
Another question I am always asked: “Leo, I’m not an IT person… can I learn Power BI?” Sure you can!!! Power BI was created for non-IT people… it is also used by IT people, but for different scenarios/project types. Power BI is a self-service BI tool. This means that non-IT people can make their reports, build their analysis and dashboards. It is really for the other sectors to decrease their dependence on IT.
This is something reflective (sink or swim), because previously the responsibility was all of IT in this process but today the most developed companies in this aspect already want total independence from other sectors. I think it is neither one nor the other, they are things that should have synergy and work together.
During the projects development, several concepts of data base are involved. Maybe that’s why this IT association with Power BI is so great. However, in several scenarios you don’t even need to know the concepts to make the developments. Of course it is important that you have this knowledge and here I will show you some of them.
To build good data models you need to study the theory of data modeling. For those who don’t know my courses, this is an aspect that I reinforce a lot!
And finally, they always ask me: “Leo, I work in the department of maintenance/projects/warehouse, Power BI will be useful for me?!” Yes it will, and I even understand this question because normally the examples that appear are for commercial, sales or financial departments. That justifies associations like that about the software! However, the tool is to analyze any kind of data, even related to maintenance, projects or warehouse.
I even use my example, where I used to work in a company and my job was to create reports and follow up judicial projects. All you need is to have the information, independent of the department!
Database
Where does the data for Power BI come from? It comes from the database:
Database (Information that are generated in systems, e.g. ERP and CRM): The ones responsible for permissions rights and maintenance of the database is usually the IT team. They can be available to analysts in some ways:
- Report Extractions: common
- IT Queries: common
- Business users with access to the transactional database (OLTP database): some cases, but has the risk of the user interrupting the database.
- Use of a Data Warehouse (OLAP database): rarely used and most recommended
- Filling out spreadsheets manually: common
Many people misunderstand thinking that they are accessing the system, but in fact they are accessing the database (e.g. SQL Server and Oracle). If you’re getting worried or in doubt because it was a lot of information, take it easy there…. grab a cup of water or a mug of coffee and lets walk through it and you’ll understand!
Do you know how a database looks like? The image below illustrates all you can have of database information (fictitious company):

Figure 1: Fictitious company database
In the image you can see the division into several tables that are related to each other. Then, when a registration occurs in your system (registration/sale/purchase/machine stop, etc…) the information goes to a database. The scheme above is very well assembled, organized and easy to read, for those who are IT or have knowledge in database…
The IT staff uses a programming language (SQL, for example) to extract a report from the database in order to bring the information into a table. What the system does behind to bring this information is a Query with the requested attributes that are separated by subject in the tables we saw in the previous image.
The problem working with huge tables happens when you need to create links between the tables and work with modeling! You may start to have some problems because you need rules and knowledge of the concept of relationships. And that can give the first hit on users that comes from Excel, this tool doesn’t have such concept on it.
Data Warehouse
Do you know what a Data Warehouse is? What is it for? If you don’t know, rest assured that you will now learn!
A Data Warehouse is nothing more than a database but focused on analysis and that contains relevant information for that. For example, if you do not need to bring the social number information of a person who made a purchase to the analysis and you have this registers in the database, that information does not need to be in the Data Warehouse.
Who builds the Data Warehouse? It is the IT team or external consulting team.
What are the challenges of building the Data Warehouse and why not all companies have one? Construction time and investment required to develop and maintain it.
With the Data Warehouse the BI development process will be like this:

Figure 2: Traditional BI process
The process items are:
- Transactional database: OLTP
- ETL: Extraction, Transform and Load
- Data Warehouse (DW): area with the best conditioned information for analysis. It can be broken down in other smaller databases (Data Marts) with information from specific departments of the company (financial, commercial, production, etc.).
- Modeling
- Report
Downloading Power BI
Well, with the knowledge that we have the next step is to download Power BI and start using!
Power BI is a Microsoft software (just like Excel, Word, etc). To download it we will search the internet “download Power BI”. By clicking on the first link, we see two options to download the file. One of them is the option to download from the Microsoft Store (for those who have Windows 10) and the other to download from the browser.

Figure 3: Google search and download selection
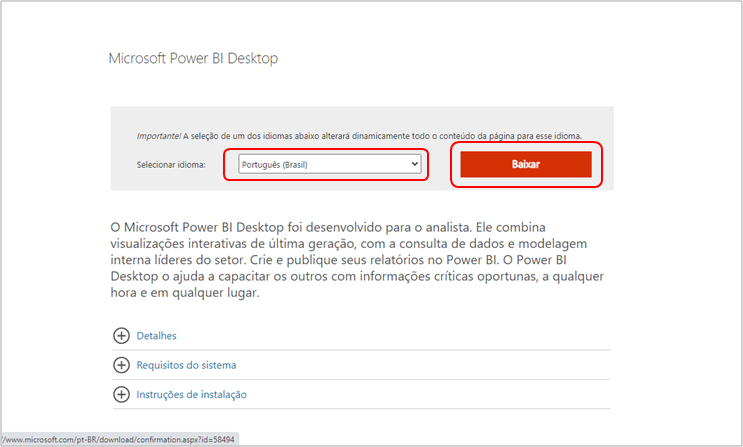
Figure 4: Browser option
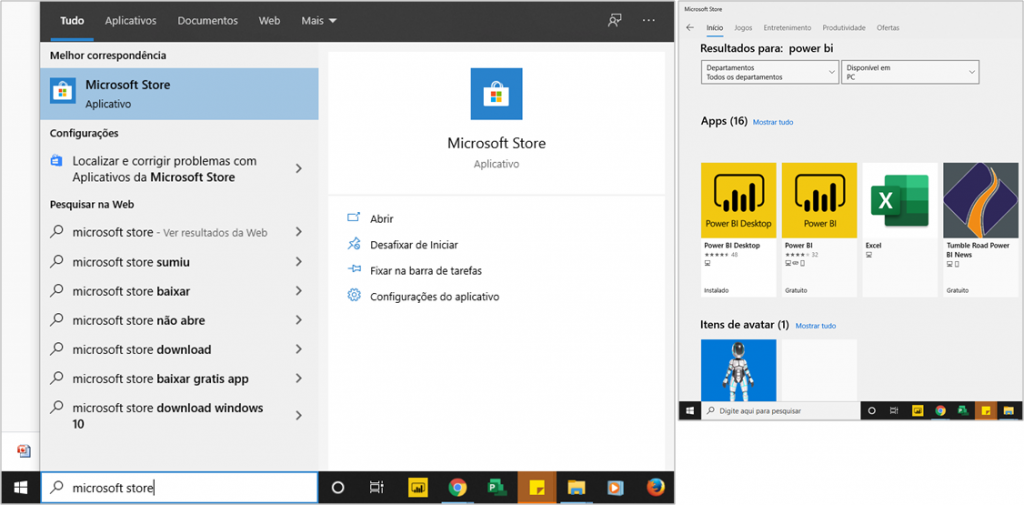
Figure 5: Opening Microsoft Store
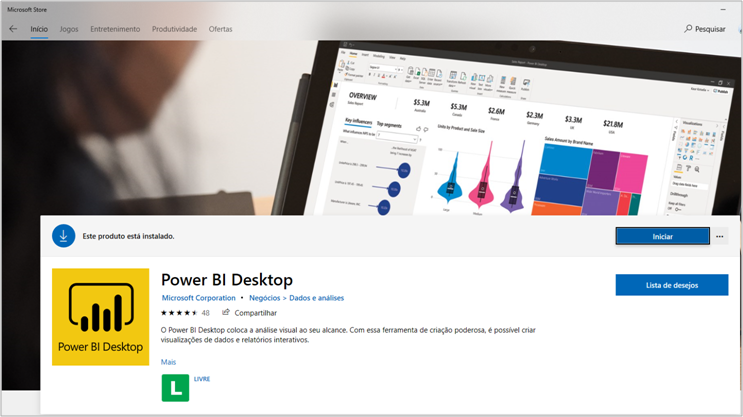
Figure 6: Choosing Power BI Desktop from Microsoft Store
Stages:
Search "download Power BI" on Google → Enter the first link → Click on "Opções de download avançadas" → Select "Português (Brasil)" in the checkbox → Clicok on "Baixar"
or
Search "Microsoft Store" on Windows → Search "Power BI Desktop" on Microsoft Store → Click on Download
| Tip: In the download step it will be necessary to know which is your processor (32 ou 64 bits). To find out, go to: https://support.microsoft.com/pt-br/help/15056/windows-32-64-bit-faq |
The installation steps are very simple. Read to understand each step, but it’s practically “next → next”. When you finish the installation, you will open Power BI, select that you already have an account and close the next two windows.

Figure 7: Selecting the account option and closing the first window
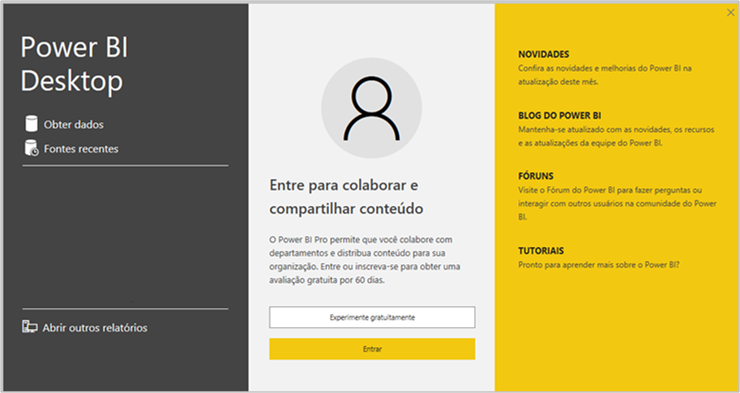
Figure 8: Closing the second window
Now you have access to the Power BI (Power BI Desktop) development area! Simple, right? Power BI is a tool that is always being updated (almost every month it has a new update). So, it is important to know which version you are using and also enable the new visualizations features.
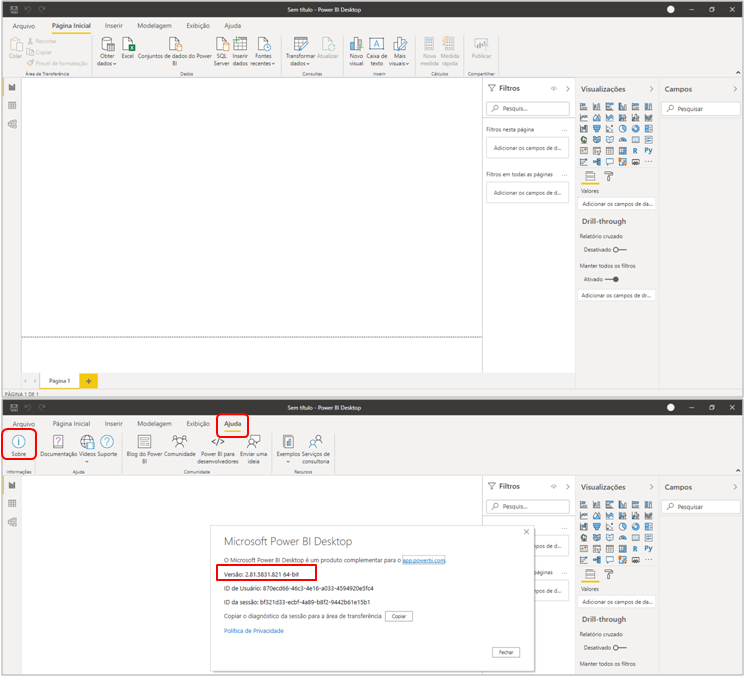
Figure 9: Home Screen and Checking the Power BI Version
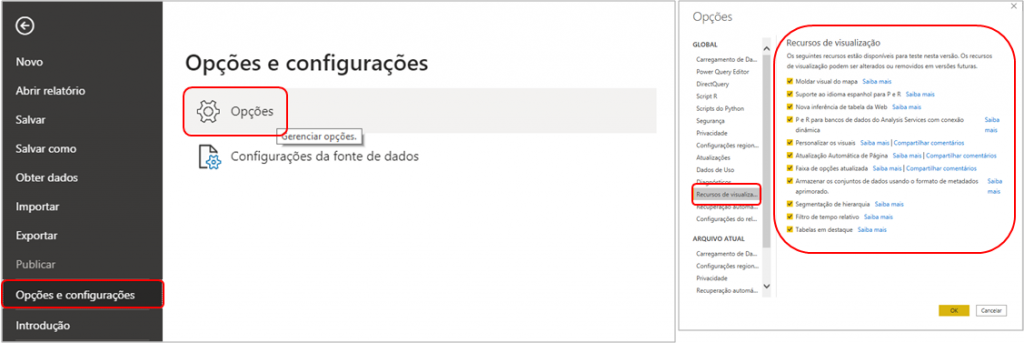
Figure 10: Enabling Viewing Features
Stages:
Click on "Ajuda" → Click on "Sobre"
Click on "Arquivo" → Click on "Opções and Configurações" → Click on "Opções" → Click on "Recursos de Visualização" → Select all → "OK"
That’s it! We are ready to start developing our reports.
Practicing
In our example, to build a dashboard from scratch we’ll use bases from the following sources:
- IT Queries
- Report Extraction
In other Lives and Blog Posts I have examples of how to make other types of connections. So, be sure to follow to learn!
The data is imported with the help of a Query passed by IT team, for example. In Excel, you can check the Queries used here:

Figure 11: Query area in Excel
Stages:
In Excel, under "Dados"  → "Consultas and Conexões"
We will import this information from Excel into Power BI:

Figure 12: Getting data from Excel into Power BI
Stages:
In Power BI, "Página Inicial" click on "Obter dados"  → "Excel"

Figure 13: File Selection
| Tip: When working with Excel tables have only one table per sheet (tab), in each of the sheets define the data area format with an easy to recognize name. |

Figure 14: Content of the imported file
Let’s select the “Vendas” table and click on load to import this information into Power BI. Here people are usually in doubt if when updating the base the Power BI will also be updated. Just click on”Atualizar” in the “Página Inicial”:

Figure 15: “Refresh” button in Power BI
| Important: The update will not occur correctly, if: – Change the structure of the file: add/change the order of columns, type data, change name of the tables, etc.. – Change the location file (loses the reference) |
Once you have imported the data, you can now view it in the same format that was in Excel:

Figure 16: “Dados” tab for content visualization
In addition to this tab, you will see two more on the left side panel of Power BI. The “Modelo” tab is the one that shows the relationship between the tables in our project. When you open it, the people already say “Gosh, what is this?!” Usually, this part of the relationship is where people have more questions at the beginning, but studying and with dedication, you can understand! It’s not a boogie man.

Figure 17: “Model” tab for relationship visualization
It’s quite typical people who goes out, report and assemble dashboards without at least having the minimal knowledge of that part of relationships. That’s because Power BI is very drag and drop. So, with logic and using the visuals you can build the report.
Let’s import the “Vendas” file from the same folder to assemble some visuals:

Figure 18: Creating a Card look

Figure 19: Creation of Bar Graph visualization
Stages:
1. In "Visualizações" select "Cartão" → Drag the "Faturamento" column to "Campos"
2. In "Visualizações" select "Gráfico de colunas empilhadas" → Drag the column from "Ano" to "Eixo" and from "Faturamento" to "Valores"
The problem starts to show when more complex analyses are requested (year over year, for example). Then it’s common to people start thinking about giving up or thinking about doing it in Excel and then importing it ready to Power BI.
You must be very careful in the second situation, because Power BI was made to perform the analysis and not stay in a back and forth with Excel. I’m talking about this “back and forth” because it’s possible to export the information from a Power BI look to a .csv file. Then comes the incredible solution to export the data and do the math in Excel. With this, you can import the file with the calculation made to Power BI:

Figure 20: Export option to .csv file
Avoid doing this as much as possible, because:
- You can do this calculation on your own Power BI
- It will make it very difficult to maintain the report
- It will be a static calculation

Figure 21: Saving the file in .csv

Figure 22: Exported file format
Stages:
1. Click on the 3 dots "..." in the upper right corner of the graphic → Select "Exportar dados" → Select the file
2. Open file in Excel
We will import this file into Power BI:

Figure 23: Getting data from .csv file
When we do this, we can see in “Modelo” that a new Table has been created. Now the problem is to join two things that came from the same base, but in different tables. Then the “attempts to make the relationship between the tables” stage starts and these attempts leads to errors.

Figure 24: Imported Table
Stages:
1. In "Página Inicial" select "Obter dados" → Select "Texto/CSV" → Select file
2. Display the imported table in "Campos" from "Relatório" and in the "Modelo" tab
| Important: Although Power BI is very iterative and easy to assemble the visulas, I believe it is essential that you understand the reason of what you are doing. So, don’t learn only in trial and error! Go after the basics and I’m sure you will succeed and do things right. |
We have already seen that we won‘t use this table, so let’s delete it:

Figure 25: Deleting Table
Understanding the types of tables
In the world of BI we name the tables in two types:
- Dimension table: any table that is related to new registration! They must have a unique key (e.g. id, code and SK) that will identify the dimension. For example, a table for registering products and customers.
- Fact table: the table that has the values (facts) of historical events/movements/events. In it, we also have the unique key to relate with the dimension tables.
From this relationship and the connection through the primary key between the tables we do not need to have everything in a single “Giant table” as normally done in Excel. So, I can analyze and bring information from any column that is in the dimension table (for example: Country of a client or group that the product fits) even if this information is not directly in the sales fact table. Therefore it’s not necessary to have everything in the fact table!
This is a fundamental point to study and really learn at the beginning, because it is a different concept from Excel and helps a lot when creating the calculations in Power BI.
Imagine that you have a “giant table” in Excel, with the sales information as follows:

Figure 26: Sales Board
And you have the following columns in it, with information of the customers who made a purchase:

Figure 27: Columns with customer information
It is possible (and correct) to separate the information of the customers in a Customer table and to keep only the Customer ID on the Sales Results table that would be the bridge (primary key) to relate the sales table (fact of sales table = “fVendas”) with the table of customers register (table customer dimension = “dCliente”).
This way we reduce 5 columns (Cliente, Continente, País, Estado e Cidade) of the table “dVendas”. This optimizes a lot the performance of your reports! Cool, isn’t it?
In a similar way, it is possible to do the same exercise for the columns with product information:

Figure 28: Columns with product information
In Power BI projects, we also created a dimension table called dCalendario. It is used to make the relationship of dates in the report.
ETL
In the examples I have shown so far, I skipped the ETL (Extraction, Transformation and Load) stage. It is enabled after we select the base that we will work on Power BI. Let’s see it again?

Figure 29: Getting data from Excel file

Figure 30: ETL Steps in Power BI
In my opinion, the two buttons should be in a different order, because the correct is to first do the transformation (structuring, cleaning, etc.) and only then load the model.
Stage:
In Power BI, "Página Inicial" click on "Obter dados"  → Select "Excel" → Select file
Applying ETL
Imagine a scenario where our database comes decomposed in Excel files with fixed periods (in this case annual) when we extract from the system.
We have the option to import all the files from a folder in a single step:

Figure 31: Folder with the files extracted from the system

Figure 32: Excel file format

Figure 33: Getting data from a folder

Figure 34: Folder path selection

Figure 35: Selection box for data transformation
Stage:
In "Página Inicial" click on "Obter dados" → Select "Mais..." → Select "Pasta" → Fill in the folder path → Click on  "Transformar Dados"
When we select “Transformar Dados” we go to the Power Query environment! This tool that we use to make the transformation. Besides IT team being able to make some Queries and transform the data to put in the Data Warehouse (DW), we can also make an ETL process on top of this information.

Figure 36: Power Query Environment

Figura 37: Algumas ferrameFigure 37: Some tools to transform data in Power Queryntas para transformar dados no Power Query
See that we have some options like Excel formulas and tools! There is one that does not stay on this page and has a functionality like VLOOKUP to get information from other tables:

Figure 38: Option to merge queries
Remember that option to combine files? We can do it here in Power Query:

Figure 39: Option to combine files
When we do this, Power Query asks us which file we will use from the sample to apply to others:

Figure 40: Sample file selection
Stage:
Click on the two down arrows in the  upper right corner of the "Content" column → "ok"
With this, we have our files stacked. However, there are other transformations to be done:

Figure 41: Result of the stacked files
The first step is to remove the lines that are useless!

Figure 42: Null filter in column 4 (Column4)
Stagee:
Click on the arrow in the upper right corner of Column4 → Deselect (nulo)
The columns have the weird names, right?! We can use the first row as a header with a Power Query tool here:

Figure 43: Header Promotion
Stage:
Click on the table tools in the upper left corner of the table → Select "Usar a Primeira Linha como Cabeçalho"
Did you notice that we have several “null” in the rows of the columns “Região”, “UF” and “Cidade”? This happens because they were merged cells and have the same value.

Figure 44: Cells with null
The logic here to fill these values is that the first value is repeated down until it finds a non-null value. Do you agree? Well, we have a tool to fill in the Power Query:

Figure 45: Use of filling in the Power Query
Stage:
Select the columns "Região", "UF" and "Cidade" → Click with the right-click in one of them → Select "Preenchimento" → Select "Para Baixo"
It is very important to evaluate the union region between the files during the transformation stage. Also, remember to filter the totals! This is a line that does not need to be taken to the model (we do this calculation in Power BI):

Figure 46: Analysis of the lines
We have the option to filter these items from our column and with that we are not taking it to the model:

Figure 47: Total filter and repeated header
Stage:
Click on the arrow in he upper right corner of column "Região" → Deselect "Região" and "Total"
It’s starting to seems nice but imagine if you have removed the wrong column by mistake, what to do? “well, just give it a ctrl +z!” negative… “ctrl +z” doesn’t work in Power Query. And there’s no need to worry because here we have a better tool, the “Etapas Aplicadas”:

Figure 48: Applied Steps Panel
| Tip: Don’t be afraid to practice in Power Query and understand what you are doing to assimilate this knowledge. This “Etapas Aplicadas” panel allows you to go back and do it differently in case something doesn’t work. |
Remember what I said about totals? We calculate that in Power BI. When I started to analyze our table I saw that we have an entire column just doing this calculation. Let’s remove it:

Figure 49: Removing total column
Stage:
Click with the right-click in the column "Total" → Select "Remover"
Our table is clean at this point! However, it is not structured. In some cases we have more than one information per column. This way, we would have problems when doing calculations and relationships in Power BI, because there we use the column model. What would be the information of each column of the model?!

Figure 50: Structure of the database columns
To work in a columnar way we would have the following: “Região”, “UF”, “Cidade”, “Faturamento”, “Quantidade”, “Mês” and “Ano”.
In other words, we must structure our table to reach this result. The first step is to transform all columns with the name of the month that has its results in the rows in two: “Mês” and “Valor” (process of transforming columns in rows = unpivot):

Figure 51: Transforming columns into rows
Stage:
Select all columns from "(Mês 01) Janeiro" until "(Mês 12) Dezembro" → In "Transformar" select "Transformar Colunas em Linhas"
And the result of the columns would look like this:

Figure 52: Unpivot result
After renaming the column (Atributo = Mês), we have to separate the column KPI in two: Quantidade and Faturamento. The two columns have the values represented in the Valor column. To make the transformation of these lines in column we will use the “Coluna Dinâmica” tool:

Figure 53: Applying dynamic column
Stage:
Select "KPI" and "Valor" Columns → In "Transformar" select "Coluna Dinâmica" → "Ok"

Figure 54: Dynamic column result
With this, we have almost all the columns! All that’s left is the “Ano”, which we will extract from the first column:

Figure 55: Content that we need to keep in the rows
We have the “Extrair” tool in Power Query that allows us to extract the content we want to keep in our column:

Figure 56: Tool to extract the content

Figure 57: Delimiters
Stages:
1. Select the column "Vendas 2017.xlsx" → In "Transformar" select "Extrair" → Select "Texto entre os delimitadores"
2. Fill in the delimiters
And the result after applying the tool and changing the name of the column to “Ano”, looks like this:

Figure 58: Year column result
That’s it! We have all the columns for our model. Did you notice the ABC next to Year? And something similar in the other columns? That’s the kind of data in that column. This is super important information for us to do calculations and relationships correctly! In our case, the type of data will look like this:
- “Ano”: 123 – Full number
- “Região”, “UF”, “Cidade” and “Mês”: ABC – Text
- “Faturamento” and “Quantidade”: 1.2 – Decimal number
With this we finish the Transformation stage! To load this in the model we use the “Fechar e aplicar”:

Figure 59: Loading the data to the model
Modeling
This step is where we create the relationship between tables (when we have more than one) and make the calculations via DAX (creation of measurements). This is a subject that I cover in other videos with many details! In today’s post it is not the intention to demonstrate this step.
Visuals
Here in visuals imagine the scenario that you need to present how was the revenue over the years and the amount of deliveries per city from the data.
In “Visualizações” we have several visuals available to assemble, doing the drag and drop:

Figure 60: Visuals available to use
For the billing analysis we will use the following column graph:

Figure 61: Visual selection
When we select a visual type some attributes appear to be filled in:

Figure 62: Attributes to be filled in
Now that we are looking for billing per year, we will put year in axis and billing in values:

Figure 63: Assembly of the visual fields
Stage:
In "Visualizações" select clustered column graphic → Set up the fields according to the image
And with that we have our first visual, the next one we will assemble is the bar graph:

Figure 64: Visual selection

Figure 65: Assembling the visual fields
Stage:
In "Visualizações" select stacked bar graph → Set up the fields according to the image

Figure 66: Final result of the page
Update
And then the million-dollar question! “Leo, what if we update the database folder with the 2020 file! Will it work?!”
Better than talking is showing! Let’s see?

Figure 67: Adding the 2020 file to the folder

Figure 68: Report update

Figure 69: 2020 data automatically included
We were able to put together our first Power BI analysis! The main thing is to wash away from your mind that you need to be an IT person or a master of Excel to learn Power BI and that if you make the effort to learn and practice with certainty you will master the tool. Follow my next Videos that I will show you in more detail about Data Warehouse, how to work with dimension tables and fact tables and forms of database connection.
If you have any questions about Live #12 or have suggestions for next Lives, leave them in the comments.
Cheers,
Leonardo